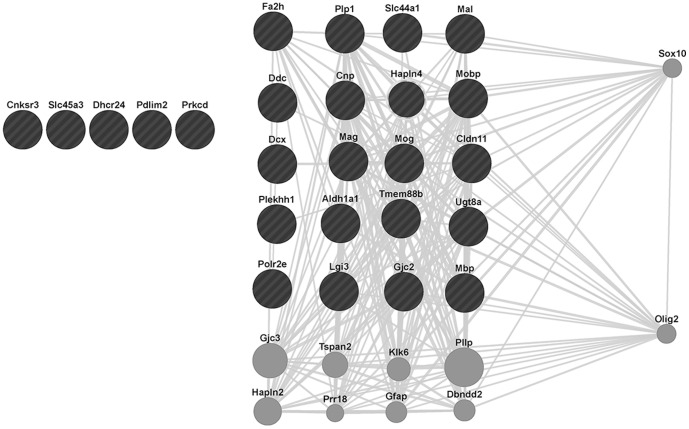
Figure 8. GeneMANIA-generated network of the queried genes (down-regulated gene probesets in C57 Hx compared to C57 Nx, listed in Table S2) illustrating the relationships of these genes with Sox10.
The black circles denote the subset of queried genes that are known to exhibit co-expression with Sox10 (gray lines),. The grey circles denote other genes that are known to exhibit these relationships with Sox10 including Olig2, which also exhibits co-expression with several of the genes in our query set. Genes in our query set which did not exhibit co-expression with Sox10 or Olig2 are represented without any connecting gray lines.

