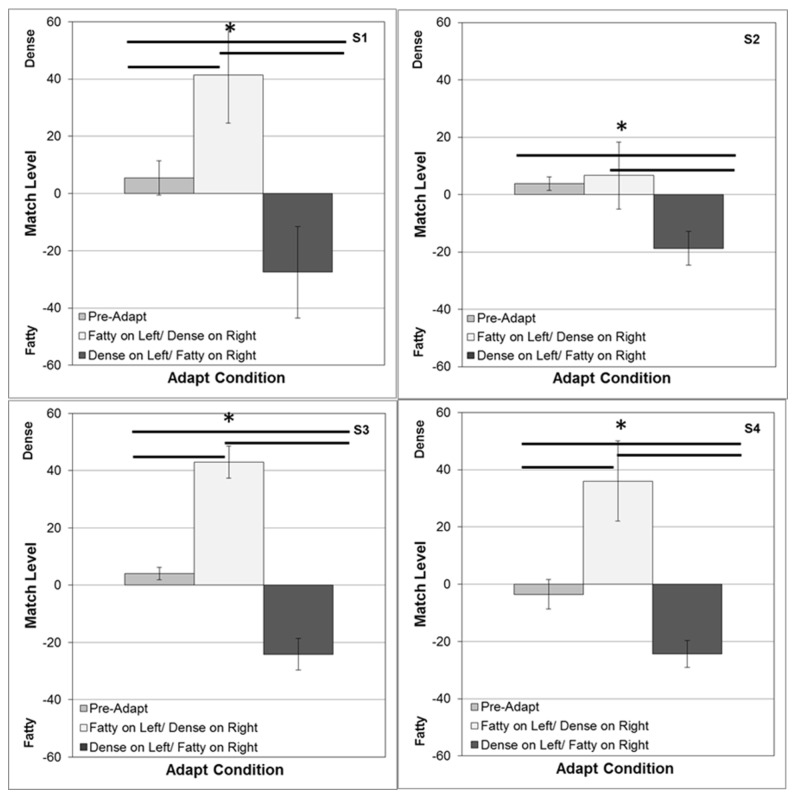
Figure 4. Aftereffects measured with opposite adapting images (dense vs. fatty) displayed in the left and right fields.
Each panel shows for one observer the array level of the image on the right that appeared to match the image on the left. Test images were yoked so that when the image was, for example, 40 on the right it was paired with a -40 image on the left. Bars show the mean settings +1 standard error, when there were no adapting images (left), when the dense image was on the right and fatty on the left (middle), or when the positions were reversed (right). Horizontal lines indicate significant differences in the settings for the 3 conditions.

