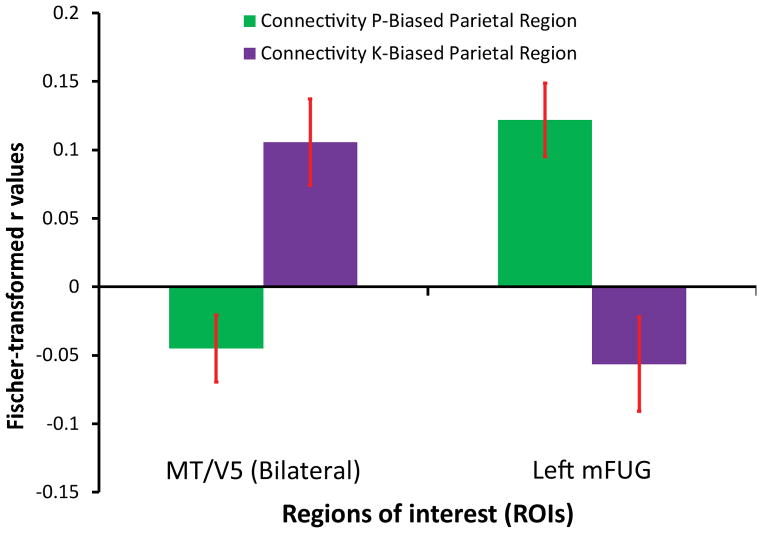
Figure 3. Functional Connectivity Analysis.
Group-level statistics were computed over the averaged Fisher transformed r values for the connectivity values between each parietal seed, defined by tool-preferences for P-biased and K-biased stimuli, and each target ROI (MT/V5 and Left Medial Fusiform Gyrus). The error bars represent the standard errors of the mean across subjects.

