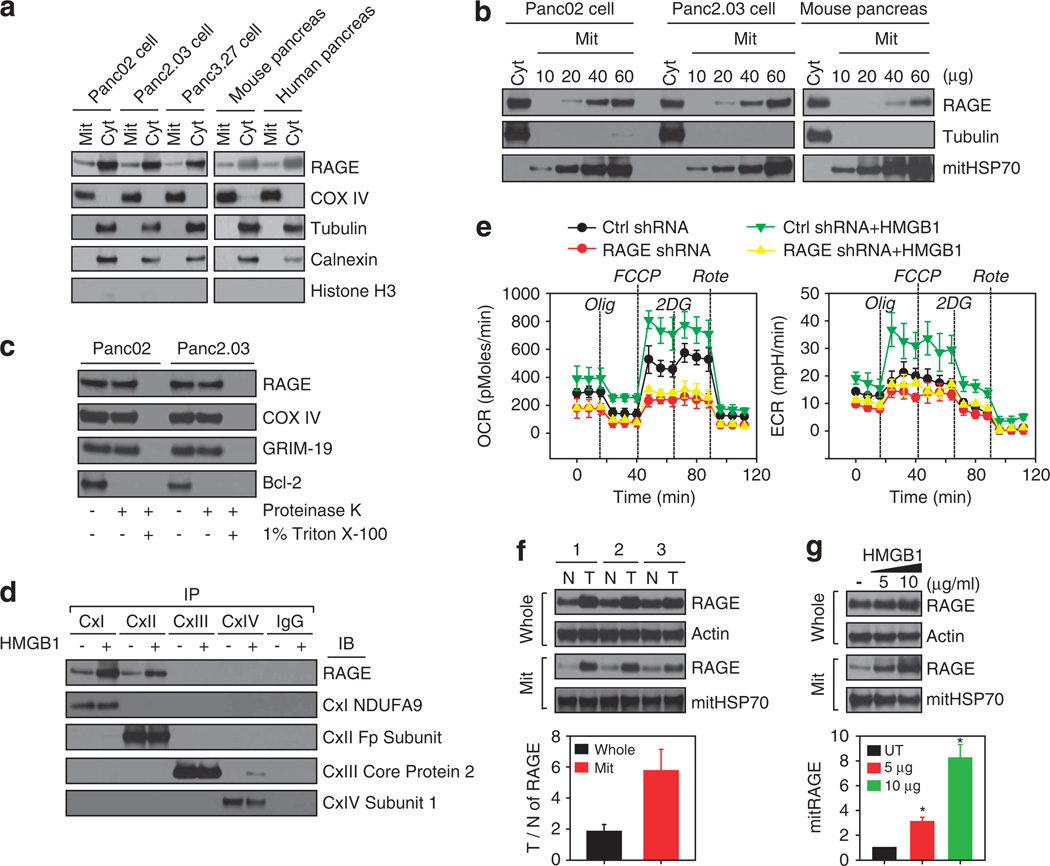
Figure 3.
HMGB1 treatment is associated with enhanced expression of RAGE in mitochondria. (a) Cytoplasmic (Cyto), and mitochondrial (Mit) was extracted from pancreatic tumor cells and pancreatic tissues were separated by SDS–PAGE. (b) Increasing amounts of mitochondrial extracts as indicated were probed for RAGE, tubulin and mitHSP70. (c) Mitochondria were isolated from pancreatic tumor cells and treated with 100 ng/ml of proteinase K for 15min in the absence or the presence of 1% Triton X-100. Samples were probed for RAGE, cytochrome oxidase IV, GRIM-19 and Bcl-2 by western blot. (d) Panc02 cells were treated with 10 µg/ml HMGB1 for 24 h, and antibodies to complex I–IV (CxI–IV) or a nonspecific control IgG were incubated with Panc02 mitochondrial extracts. Immunoprecipitates were resolved on SDS–PAGE and probed for RAGE, CxI NDUFA9, CxII Fp subunit, CxIII core protein 2 and CxIV subunit I by western blot. (e) RAGE knockdown (‘RAGE shRNA’) and wild-type (‘ctrl shRNA’) Panc02 cells were pretreated with 5µg/ml HMGB1 for 24 h, and then treated with oligomycin (1 um), p-trifluoromethoxy carbonyl cyanide phenyl hydrazone (‘FCCP’, 0.3 um), ‘2DG’, 100 mm, and Rote, 1 um sequentially as indicated. OCR and ECR were monitored using the Seahorse Bioscience Extracellular Flux Analyzer in real time (mean±s.d., n =3). (f) Western blot analysis indicated protein in samples from whole or mitochondrial extract from pancreatic tumor (‘T’) or nearby normal control (‘N’) tissues. Representative western blots (top panel) and quantifications of five patient tissues (bottom) are shown. (g) Panc02 cells were treated with 5–10 µg/ml HMGB1 for 24 h. Western blot analysis was then performed to detect RAGE, actin or mitHSP70 in whole cells or mitochondrial extracts. Relative mitRAGE (bottom panel) is shown as mean±s.d. (n=3 *P <0.001 versus control).

