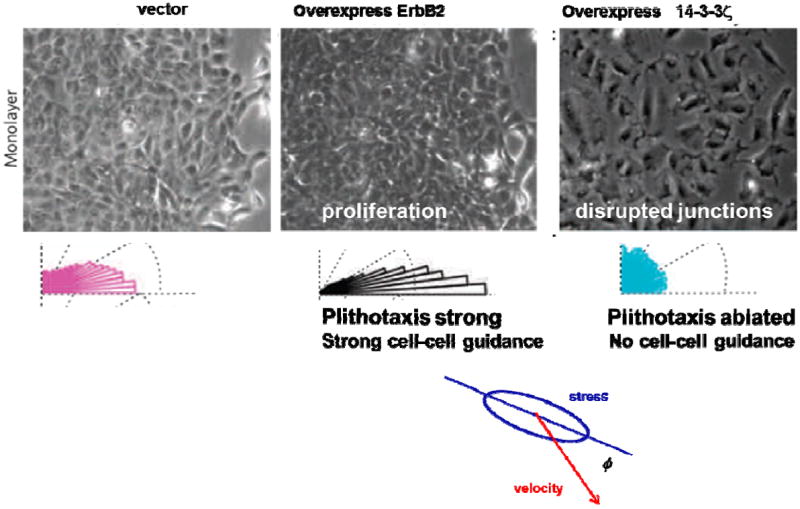
Fig. 3. Stress maps and migration in monolayers of breast-cancer model systems.

Phase contrast image of nontransformed human mammary epithelial cell line, MCF10A, control or vector, cells overexpressing ErbB2, and 14-3-3ζ. The angle ϕ defines the orientation between the maximal principle stress and the migration velocity. In each case, the histogram of ϕ is plotted as a rose of directions. Adapted with permission from 15.
