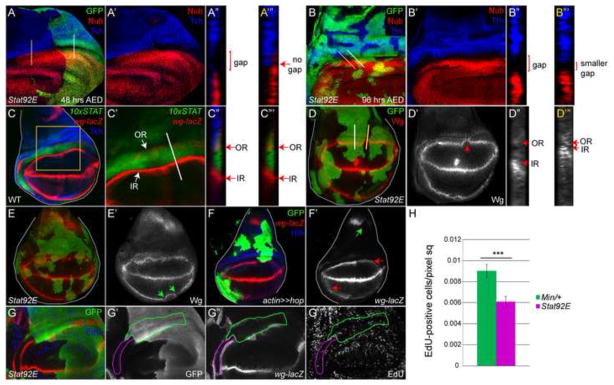
Figure 4. JAK/STAT signaling is required for growth of the gap domain.

(A, B) Stat92E clones induced at 48 (A) or 96 (B) hours AED, marked by the absence of GFP, result in loss (A) or reduction (B) of the gap domain and juxtaposition of the Tsh (blue) and Nub (red) domains. xz sections are marked in (A, B) by white and yellow lines crossing heterozygous (A″, B″) and mutant (A‴, B‴) tissue, respectively. Nub and Tsh expression are shown together in A′ and B′.
(C) In wild type, the Wg OR (red) lies within the proximal region in cells that express high levels of JAK/STAT signaling (green). By contrast the Wg IR (red) abuts the distal end of JAK/STAT activity in the gap domain. C′ shows a close up of the area outlined by the yellow box in C. The region that was scanned as an xz section is marked by a white line in C′. C″ shows 10xSTAT-GFP, wg and Tsh (blue). C‴ shows 10xSTAT-GFP and wg. Note the overlap of 10xSTAT-GFP with the Wg OR and mutual exclusion of 10xSTAT-GFP with the Wg IR.
(D, E) Stat92E clones in the hinge marked by the absence of GFP result in a proximal shift of the Wg IR (red) moving it closer to the Wg OR (also red) (D′, E′, arrow) compared to surrounding heterozygous tissue. xz sections of Wg (white) through heterozygous Stat92E tissue (white line) is shown in D″ and through Stat92E homozygous mutant tissue (yellow line) is shown in D‴. Note the collapse of the Wg IR onto the Wg OR in D‴. D′, E′ are single channels for Wg.
(F) The region between the Wg IR and OR (marked by wg-lacZ, red) is not increased in Hop flip-out clones (green) (F′, arrows). By contrast, wg in the notum is repressed by ectopic activation of the JAK/STAT pathway (F, green arrow). F′ is single channel for wg-lacZ.
(G, H) Within the gap domain, Stat92E mutant tissue, marked by the absence of GFP, contains fewer EdU-positive (blue) cells than heterozygous tissue, marked by the presence of GFP. wg-lacZ (red) marks the Wg IR and OR. A magenta line marks the Stat92E mutant tissue and a green line marks the heterozygous tissue located between the Wg IR and Wg OR (G′-G‴). G′ is single channel for GFP; G″ for wg-lacZ; G‴ for EdU. Graphical representation of EdU-positive cells in Stat92E mutant (magenta bar) or heterozygous (labeled Min/+) (green bar) tissue in 10 wing discs. The mean of the number of EdU positive cells/pixels sq +/− the standard deviation of the mean is 0.0090 +/ 0.0006 in Min/+ tissue and 0.0061 +/− 0.00051 in Stat92E mutant tissue. Asterisks indicate a statistically significant difference between these genotypes (P<0.002).
