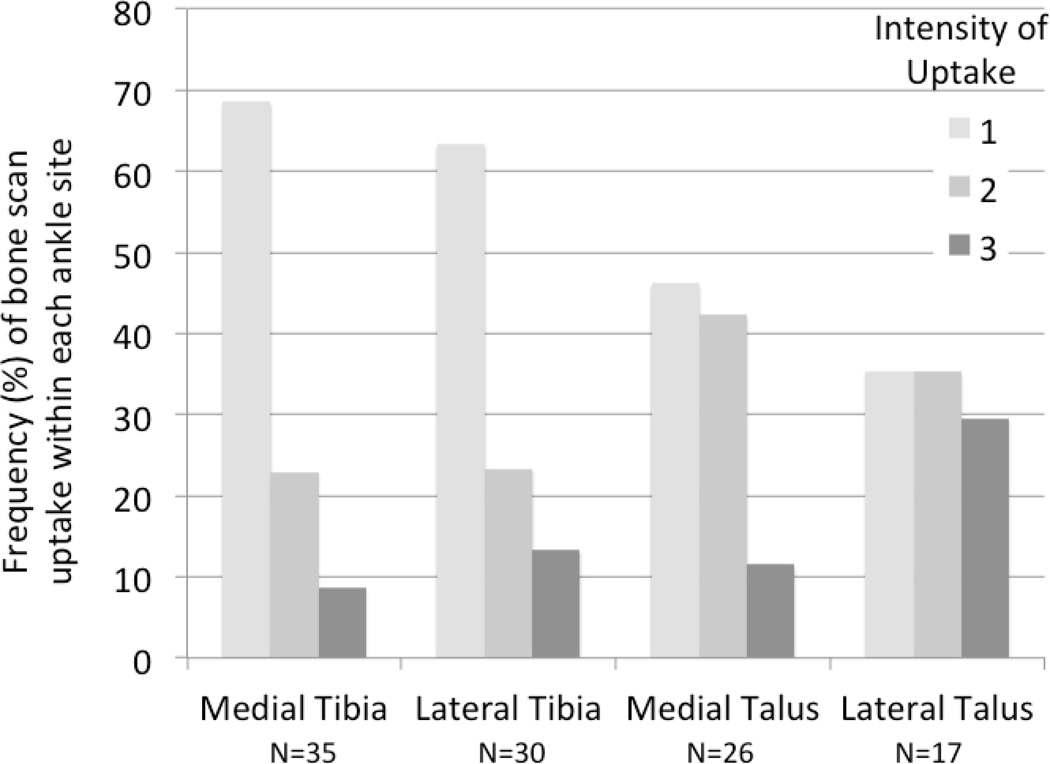
Figure 2. Frequency and localization of scintigraphic abnormalities in the ankle.
A total of 318 ankle joints were scored for intensity of scintigraphic uptake based on a four-point scale (0=none, 1=mild, 2=moderate, 3=intense uptake) by compartment (medial or lateral) and bone site (talar and/or tibial). A total of 108 sites in 70 ankles had abnormal scintigraphic uptake (score >1). The frequency of bone scan uptake for each level of intensity (0–3) is depicted as a % for each site.

