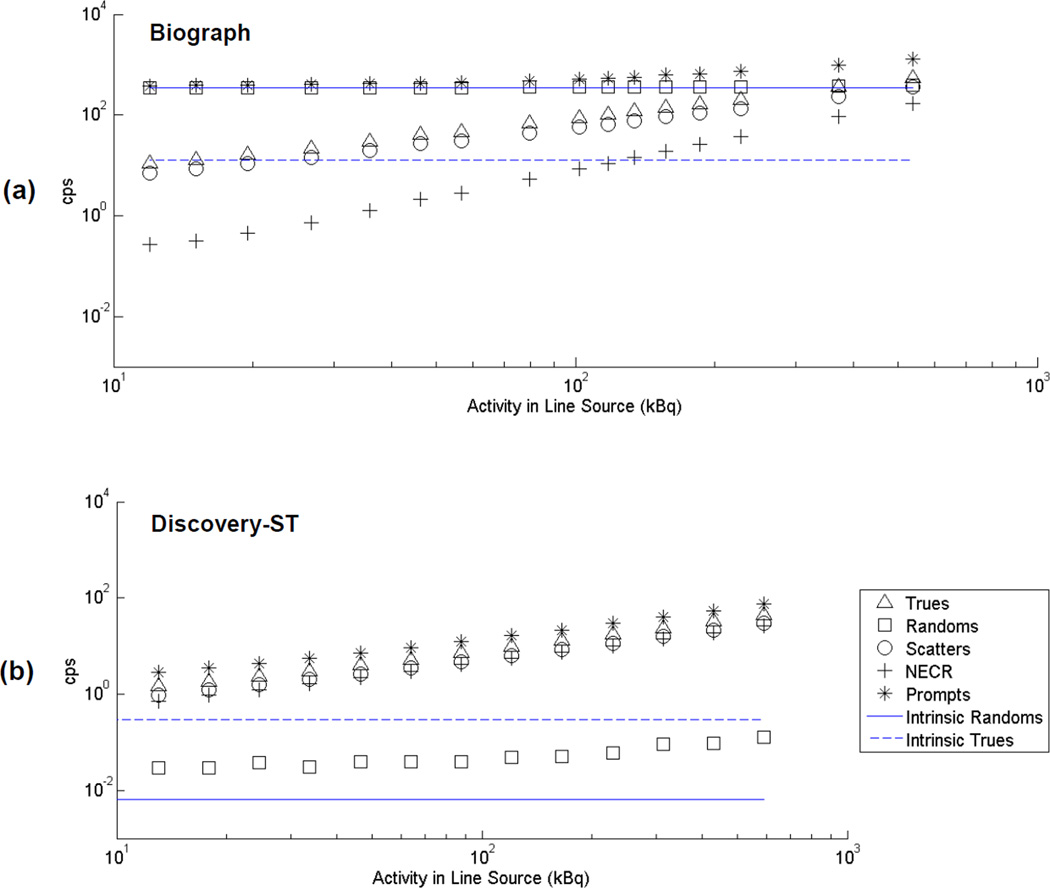
Figure 1.
Counting rates versus activity for the Biograph (a) and Discovery-ST (b) scanners for total line source activities in the range 10–600 kBq. The energy window was 375–650 keV. Plots are on a logarithmic scale to aid in visualization of the entire dynamic range. Background (intrinsic) true and random coincidence rates (phantom present, but no activity) also are shown.

