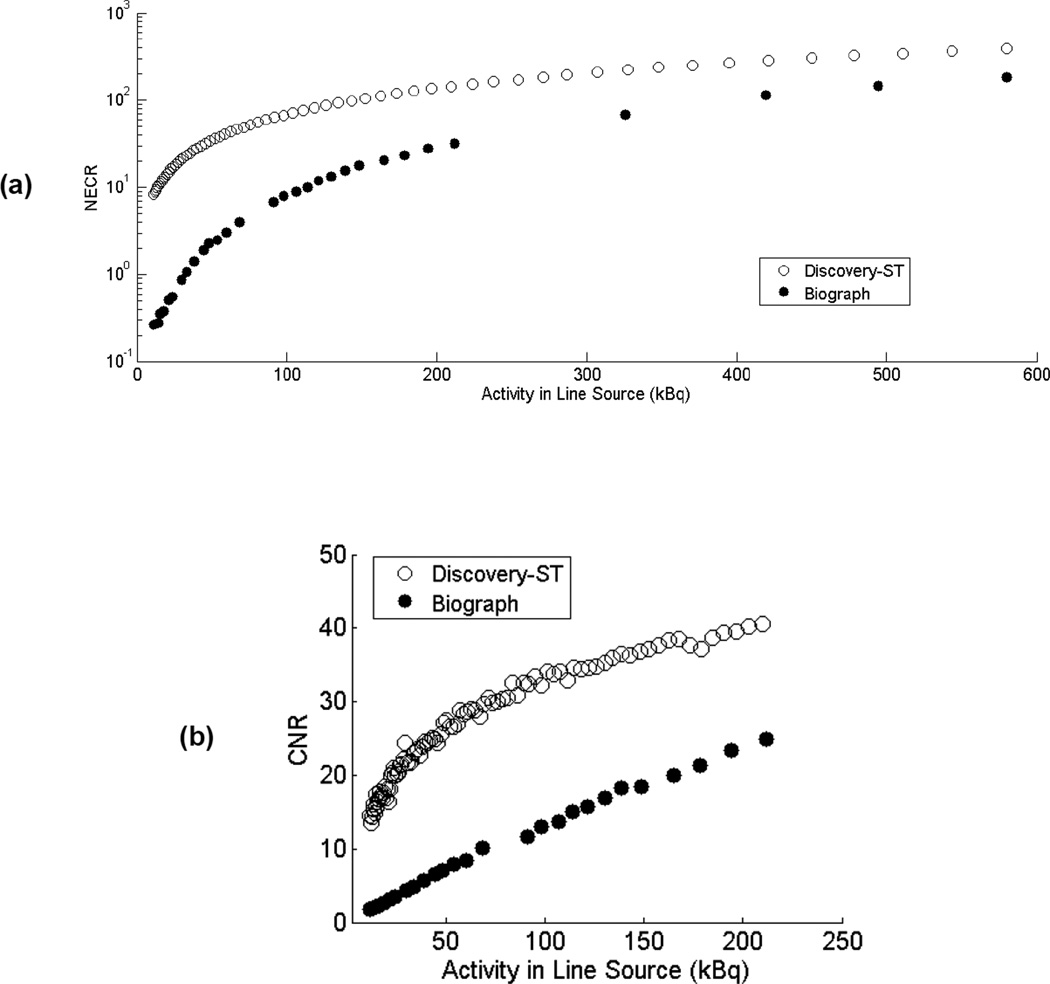
Figure 2.
NECR (a) and CNR (b) measurements for the Biograph and Discovery-ST scanners at low activities using an energy window of 375–650 keV. Measured activity ranges are 10–600 kBq for the NECR measurement and truncated to 10–220 kBq for the CNR measurement to make the data easier to visualize. Note that NECR are displayed on a logarithmic scale.

