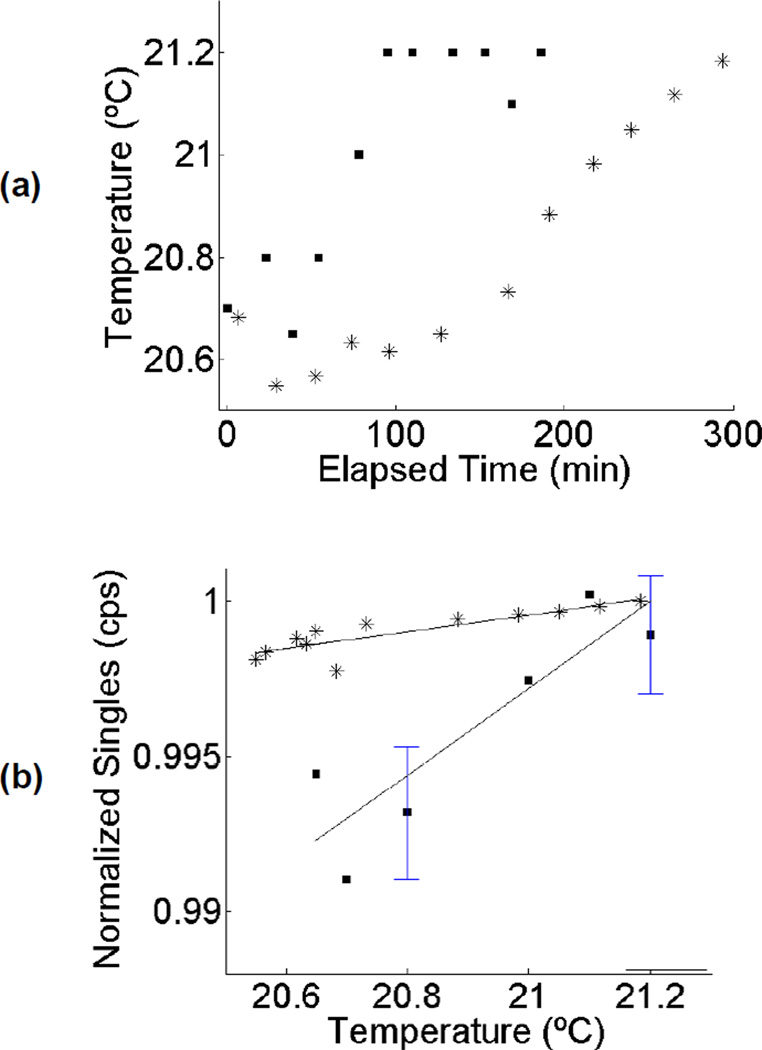
Figure 4.
(a) Change in temperature versus elapsed time for two different multi-hour acquisitions on the Siemens Biograph scanner (each acquisition denoted by a different symbol). (b) Recorded singles rate due to LSO background (normalized to arbitrary units) versus temperature for the same two acquisitions. Solid lines represent linear fit, with R2 values of 0.78 and 0.74. For the case of multiple counting rate measurements at a single temperature, sample mean and error bars are shown. Error bars are +/− one standard deviation of the mean counting rate.

