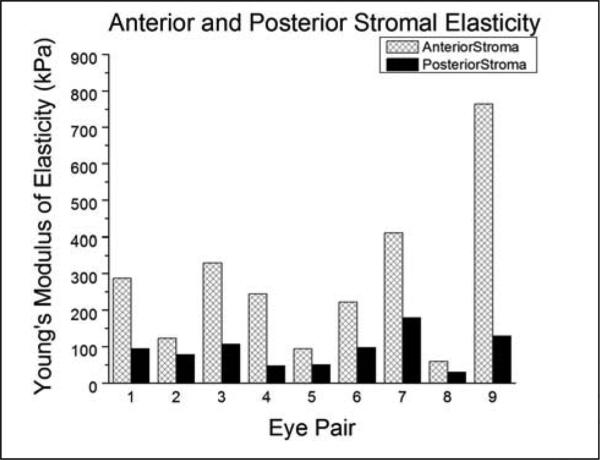
Figure 2.
Bar Graph of Anterior Stromal Elasticity and Posterior Stromal Elasticity. A bar graph comparing the Young's modulus of elasticity of the anterior stroma and posterior stroma for each respective eye pair is shown. Right eyes were subjected to anterior stromal elasticity testing and left eyes were subjected to posterior stromal elasticity testing using atomic force microscopy.

