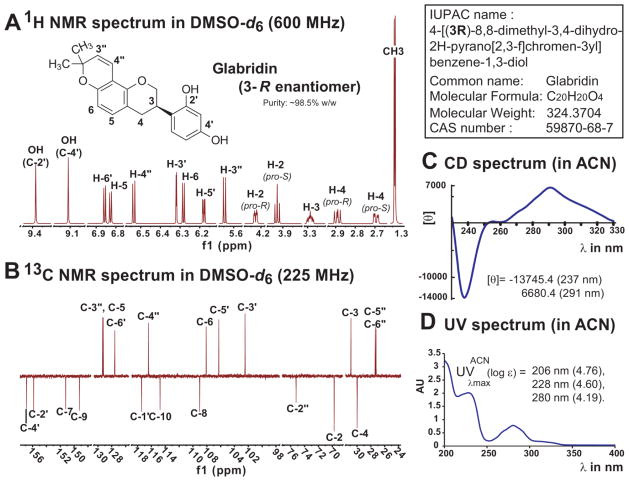
Figure 4. Chemical Characterization of Glabridin (1D qNMR, UV and CD spectra).
Panels A and B represent the 1D, 1H and 13C (DEPT-Q) NMR spectra of Glab in DMSOd6, which were acquired by us. This solvent avoids overlap of the NMR resonances for most modern high-fields magnets. Precise 1H and 13C chemical shifts corresponding to this figure are available in Table 1 and were determined according to HMBC and HSQC correlations. 1H and 13C chemical shifts of Glab in DMSO-d6 at 300 MHz and in CDCl3 at 400 MHz are available in Appendix A. The comparative 1H NMR spectra in DMSO-d6 and CDCl3 at 900 MHz is available in Appendix B. Panel C shows the CD spectrum of enantio-pure 3R-glabridin obtained from a crystal sample and in accordance with previous data [42]. Panel D gives the characteristic UV spectrum of this prenylated isoflavan also acquired in acetonitrile. The Infra-Red (IR) spectrum is available in Appendix C. HPTLC profiles of Glab and G. glabra crude extracts are in Appendix D.

