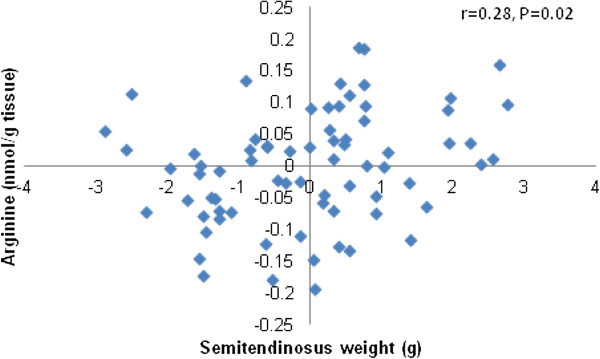
Figure 2.

Partial correlation plot for ST muscle weight with arginine concentration. The plot graphic shows the partial correlation analysis for ST muscle weight (g) with arginine concentration (nmol/g wet tissue). The analysis considered pooled data of all fetuses and was performed after accounting for the effects of pregnancy rank, maternal size and nutrition.
