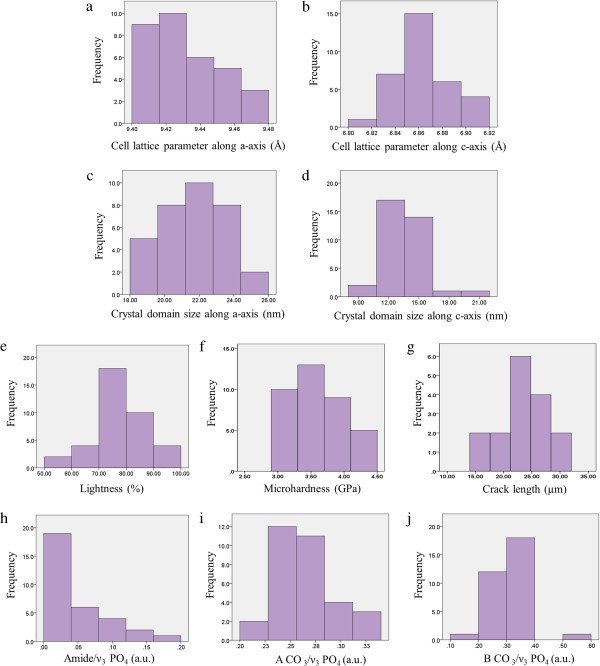
Figure 1.

Frequency histograms describing the variations in physical-chemical properties of tooth enamel: cell lattice parameters along (a) a-axis and (b) c-axis; crystal domain length along (c) a-axis and (d) c-axis; (e) tooth shade lightness, (f) hardness and (g) average crack length; (h) the organic relative content and carbonate relative content [(i) type A and (j) type B] in enamel mineral matrix among the examined teeth.
