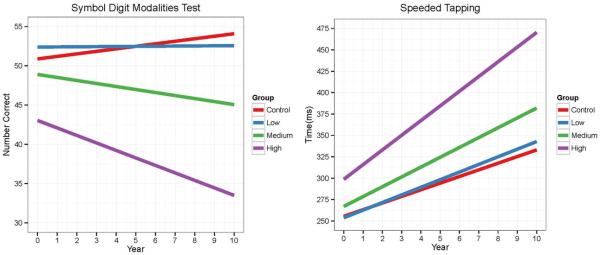
Figure 1.

CAP group fitted curves over time for SDMT (left) and speeded tapping (right).
The left-hand graph shows the fitted curves (based on the LMER fitted model) of SDMT in its original scale by year for the CAP groups. The right-hand graph shows the fitted curves for speeded tapping.
