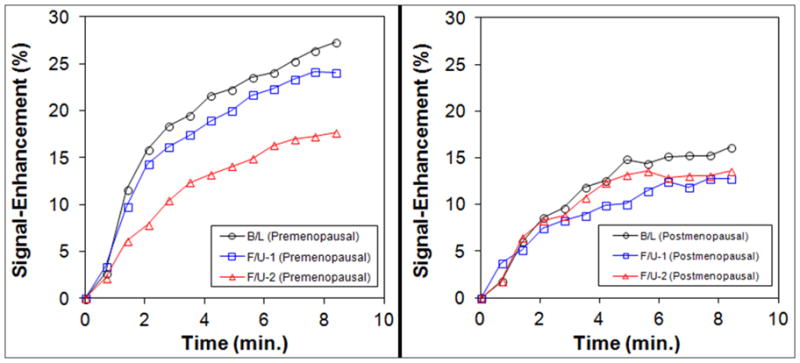
Figure 2.

BPE before and after NAC in women < 55 y/o (left) and women ≥55 y/o (right). The enhancement scale in the y-axis is the same. It is clearly noted that the level of BPE is higher in the < 55 y/o than the ≥ 55 y/o groups. The BPE decreases from B/L to F/U-1 to F/U-2 in < 55 y/o group, but not in ≥ 55 y/o group.
