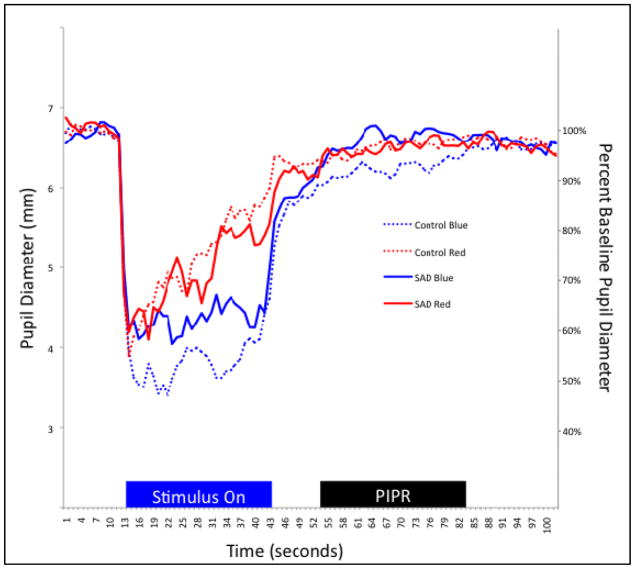
Figure 1.
Time trace plot of the pupillary response to the blue and red stimuli for one representative SAD participant and one Control participant.
Notes: Stimulus duration, shown in the blue “Stimulus On” block, was for 30 seconds, following 7 seconds of baseline recording. PIPR, shown in the black “PIPR” block, was measured starting 10 seconds after light offset for 30 seconds. Oscillations evident in the individual traces are attributed to the lack of midriasis and stimulus presentation to both eyes, including the eye being measured.

