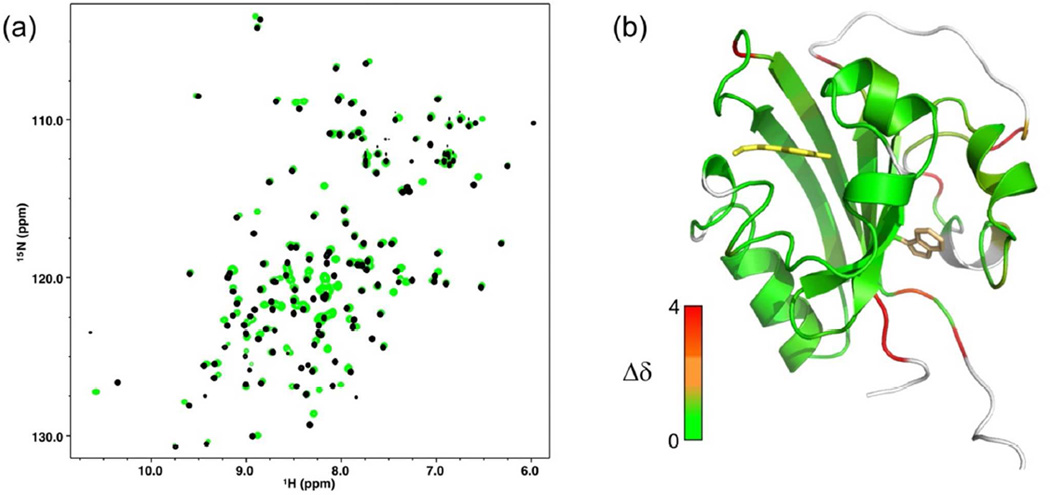
Figure 3.
(a)15N,1H-HSQC spectrum of wtPYP (black) and cPYP (green). For assignments see supporting information (b). Modeled structure of cPYP (based on wt PYP 1NWZ) (36) with residues colored according to chemical shift difference from wtPYP (BMRB code: 18122) (38). The chemical shift difference was calculated as The Trp side chain is shown in orange sticks. Note that the indole NH peak moves relative to wtPYP. (pH 7.5 Tris-acetate EDTA buffer, 100 mM NaCl, 20°C). Model produced using PyMol.

