
Figure 4.
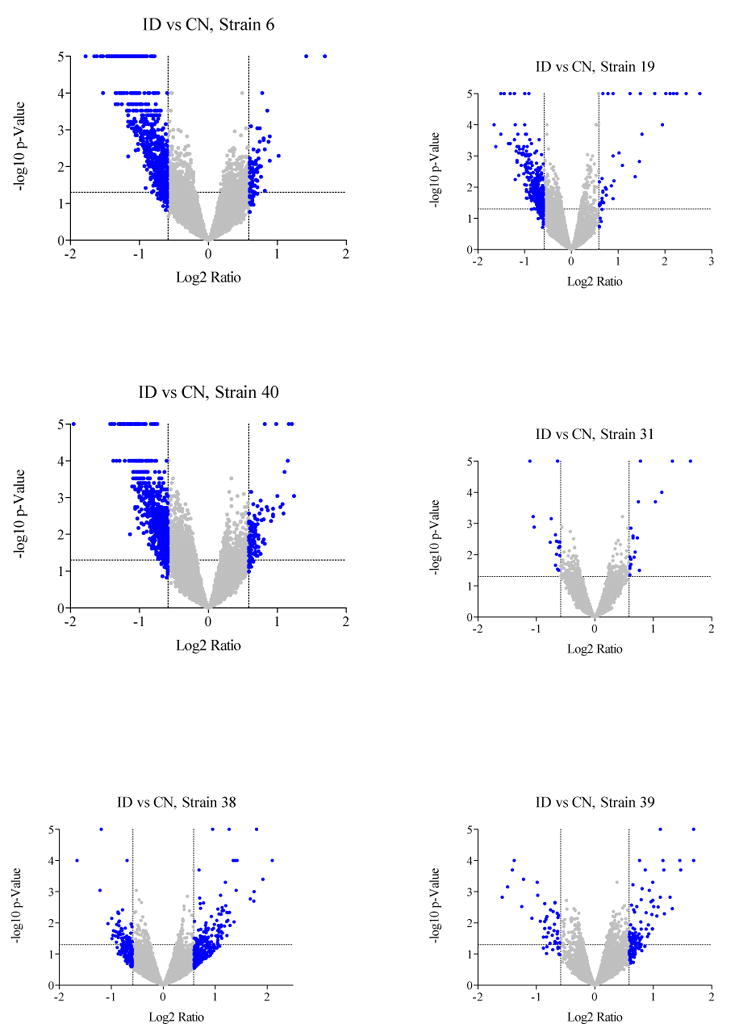
Volcano Plots illustrating strain-based differences in the effects of iron deficiency on gene expression in the VMB. Each point represents a single probe on the Illumina array; probes are distributed in terms of significance (y-axis) and fold-change (x-axis) when iron deficient mice are compared to control mice within each strain. Points highlighted in grey reached significance (p<0.05) and/or showed more than 1.5-fold change in expression.