
Figure 6.
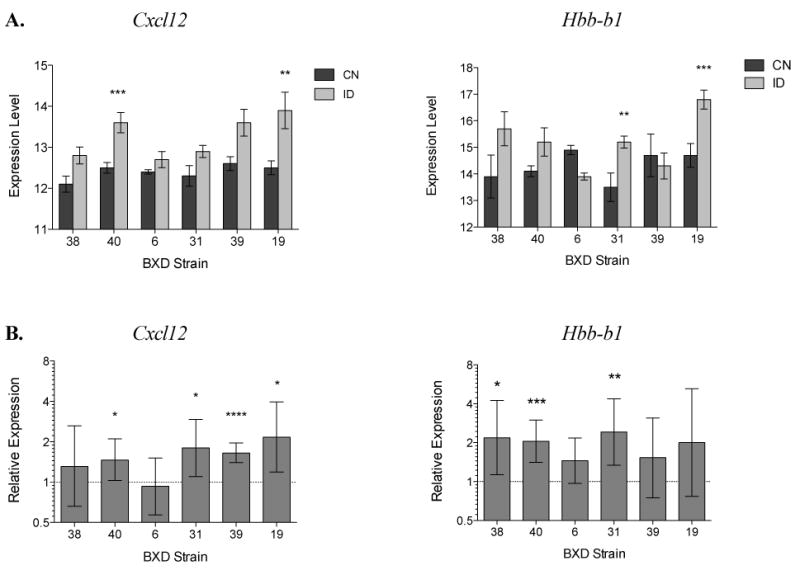
Within-strain RT-PCR confirmation of increases in expression of Hbb-b1 and Cxcl12 in ID versus CN mice. A. Results from Illumina Beadchip microarray analysis (*=Q<0.05, **=Q<0.01, ***=Q<0.001) B. Results from RT-PCR anslysis. Relative expression refers to the log2 ratio (LR) of ID/CN values, determined using the ΔΔCT method. A value of 1 on the y-axis is equivalent to a 2-fold increase in expression in mice fed the low iron diet. Error bars indicate 95% CI of the mean difference in expression (*=p<0.05, **=p<0.01, ***=p<0.001).