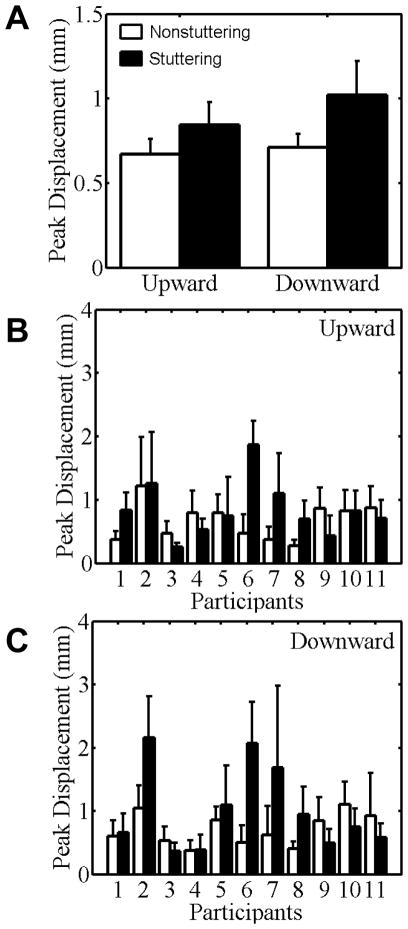
Figure 2.
Peak displacement data for stuttering (black bars) and nonstuttering (white bars) participants’ minimal jaw movements in Task I. Group mean data for the upward and downward directions are shown in panel A. Individual participant data for the upward and downward directions are shown in panels B and C, respectively. Participants are rank-ordered from lowest to highest stuttering frequency. Error bars indicate standard errors.

