Figure 3.
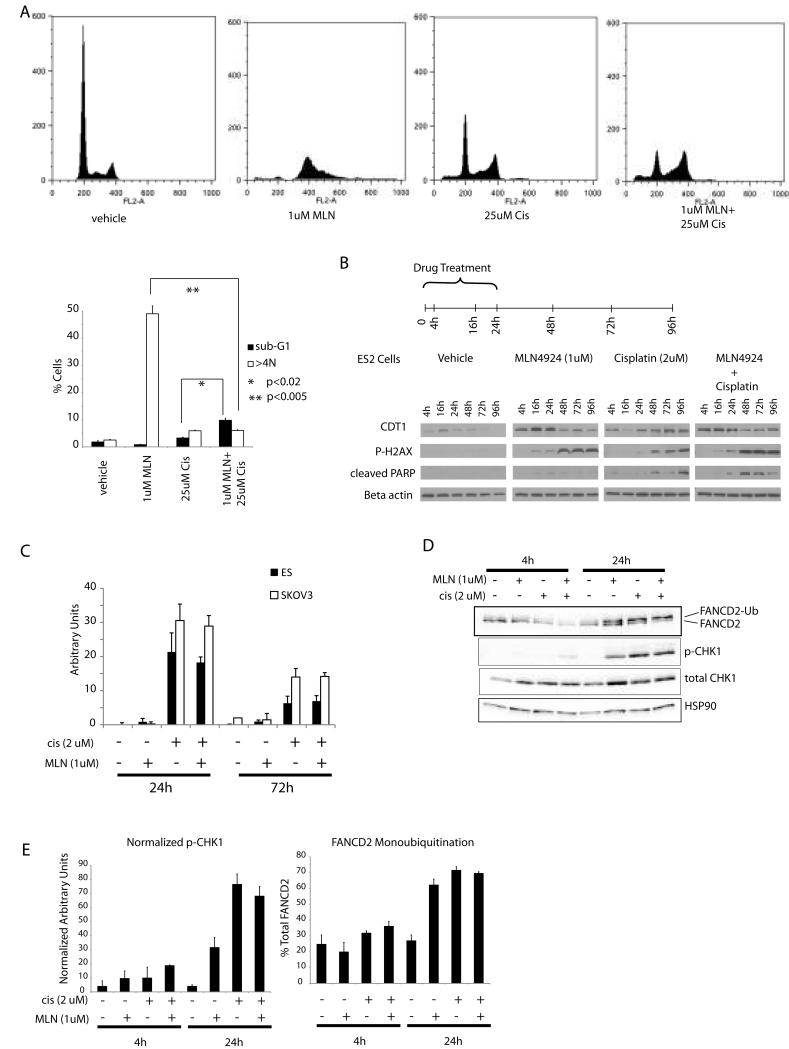
Cell cycle profile following treatment with MLN4924 and cisplatin. A. Top panel: reresentative propidium iodide FACS histograms of SKOV3 ovarian cancer cells treated with vehicle only, cisplatin, MLN4924, or the combination. Following 24h of drug treatment cells were washed with PBS and incubated with fresh media, and harvested 48h later for cell cycle analysis. Bottom panel: bar graph represents the proportion of cells with subG1 and >4N profiles. Error bars represent sd. B. Time course of CDT1 accumulation, DNA damage, and apoptosis following treatment with MLN4924 and cisplatin. Duration of drug treatment was 24h except for the 4 and 16h time points. For the later time points cells were washed with PBS and incubated with fresh media after 24h of drug treatment. C. Cisplatin-DNA adductlevels as determined by an ELISA in SKOV3 and ES2 cells treated with cisplatin for 24h with or without MLN4924. Error bars represent sd. D. FANCD2 monoubiquitination and p-CHK1 (Ser 345) in ES2 cells 4 and 24h after initiation of treatment. E. Bar graphs represent densitometric quantitation of the mono-ubiquitinated form of FANCD2 (as percentage of total FANCD2), and relative abundance of phosphorylated CHK1 (Ser345) (normalized to HSP-90 used as a loading control). Error bars represent sd.

