
Figure 4. DNA-damage induced dynamics of cellular PARylation.
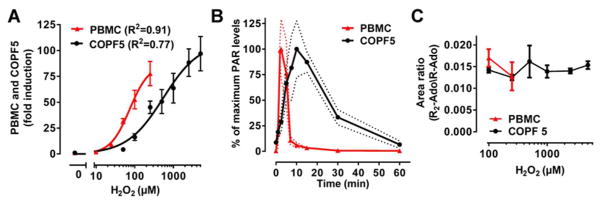
(A) Dose response curves of PAR levels in COPF5 cells and PBMCs (isolated from the same donor, inter-day variability) treated with H2O2 for 5 min. Curves were fitted using a sigmoidal model with variable slope. (B) Time course of PAR formation in COPF5 cells and PBMCs treated with 100 μM H2O2. Data represent means ± SEM from at least three independent experiments. In each experiment PBMCs were isolated from one donor on different days. (C) Assessment of PAR branching by evaluation of the R2-Ado/R-Ado area ratios in COPF5 cells and PBMCs upon H2O2 stimulation as indicated.