
Figure 6. Analysis of PARylation in mouse tissue.
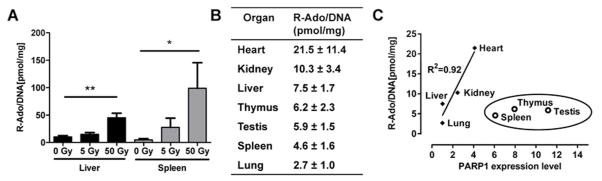
X-ray-induced (A) and basal (B) PAR levels in mouse tissue normalized to tissue DNA content. Data represent means ± SEM from at least three independent experiments. *P<0.05, **P<0.01 (Friedman test). (C) Correlation analysis of PAR levels and PARP1 mRNA expression levels as analyzed by RT-qPCR.