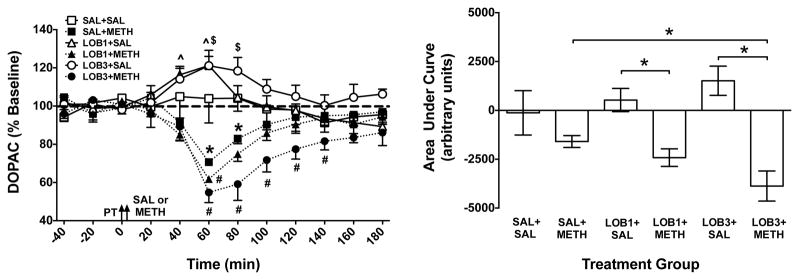
Figure 4. Extracellular DOPAC Concentrations in NAc Shell Following LOB and/or METH.

Left Panel: Mean (± SEM) extracellular DOPAC concentration in dialysate as a percent of baseline for each time point following administration of saline (SAL), lobeline (LOB; 1 or 3 mg/kg) and/or methamphetamine (METH; 0.5 mg/kg). Arrows indicate time of pretreatment (PT) and treatment (SAL or METH). The thick dashed line represents baseline, expressed as 100%. *Indicates significant within-group change in DOPAC in the SAL+METH group relative to baseline (p<0.05); ^ indicates significant within-group change in DOPAC in LOB1+SAL group relative to baseline (p<0.05); $ indicates significant within-group change in DOPAC in LOB3+SAL group relative to baseline (p<0.05); and # indicates a significant between-group difference from the SAL+METH group at the same time point (p<0.05), n = 4–7 rats per group. Right Panel: Area under the curve (AUC) following treatment for each group. *Indicates significant difference between groups (p<0.05), n = 4–7 rats per group.
