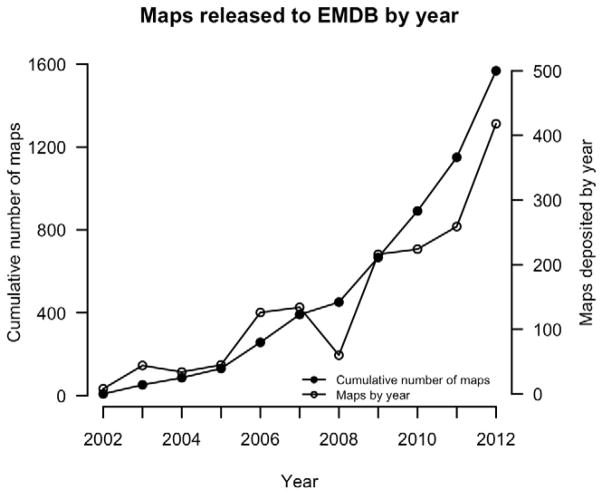
Figure 1.
The growth in the number of EM Maps in the Electron Microscopy Data Bank. The total number of entries at each year (horizontal axis), starting in 2002, is shown as a continuous line with filled circles as markers (left vertical axis). Additionally, a continuous line with unfilled circles shows the number of entries deposited each year (right vertical axis).

