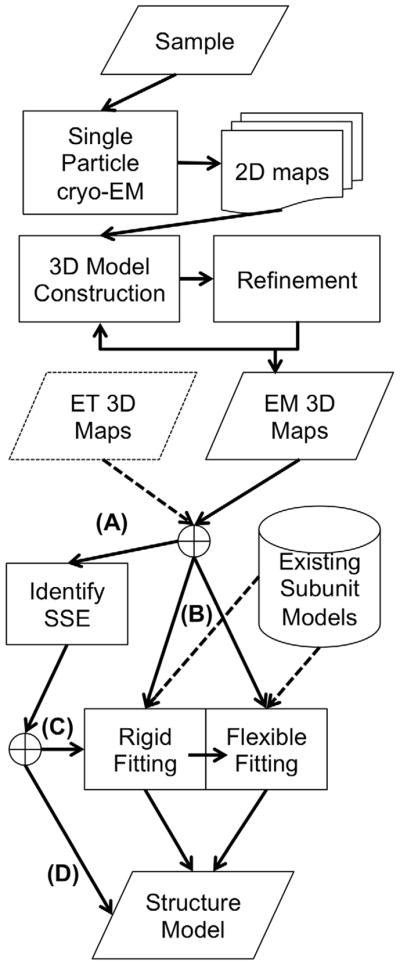
Figure 3.

Steps involved in constructing structure models of proteins from an EM map. The first steps involve experiments such as sample preparation and single-particle cryo-EM data collection. Once a 3D EM map is constructed, computational methods are applied to build structural models, which range from determining secondary structure elements to rigid-fitting and flexible fitting approaches. (A) α-helices start to be identifiable in an EM map if its resolution is 10 Å or higher and they can be clearly identified at 6 Å resolution, while β-sheets can be identified in a map at around 5 Å. To follow this route in the diagram the input EM maps should meet the resolution. (B) In order to perform structural fitting to a map the user needs to have atomic-detailed models of the subunits to fit. These can come either from X-ray, NMR spectroscopy, or computational modeling. (C) Some methods use the identified SSEs as input to their rigid fitting algorithm. (D) Coarse-grain models that provide only a backbone trace can be directly derived from identified SSEs in the EM map.
