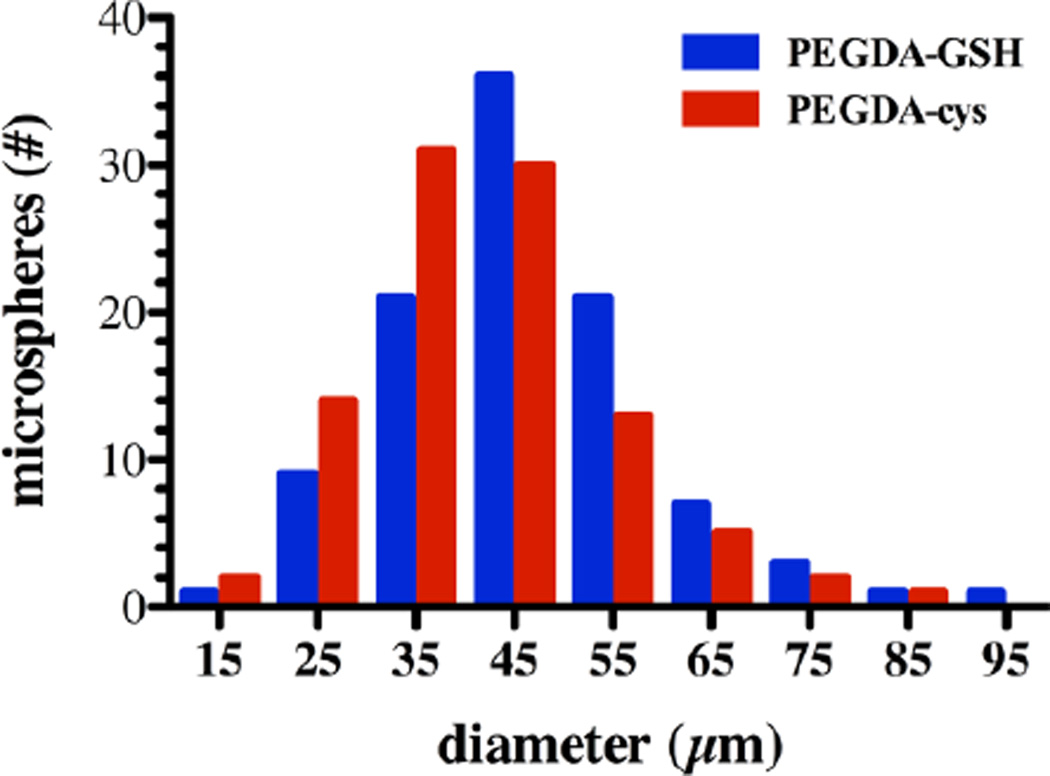
Fig. 3. Size Distribution of PEGDA-GSH and PEGDA-cys microspheres.
Representative histogram showing the diameters of PEGDA-GSH (blue) and PEGDA-cys (red) microspheres from a single production batch. Three batches were used to calculate average microsphere diameter and are presented in Table 2.

