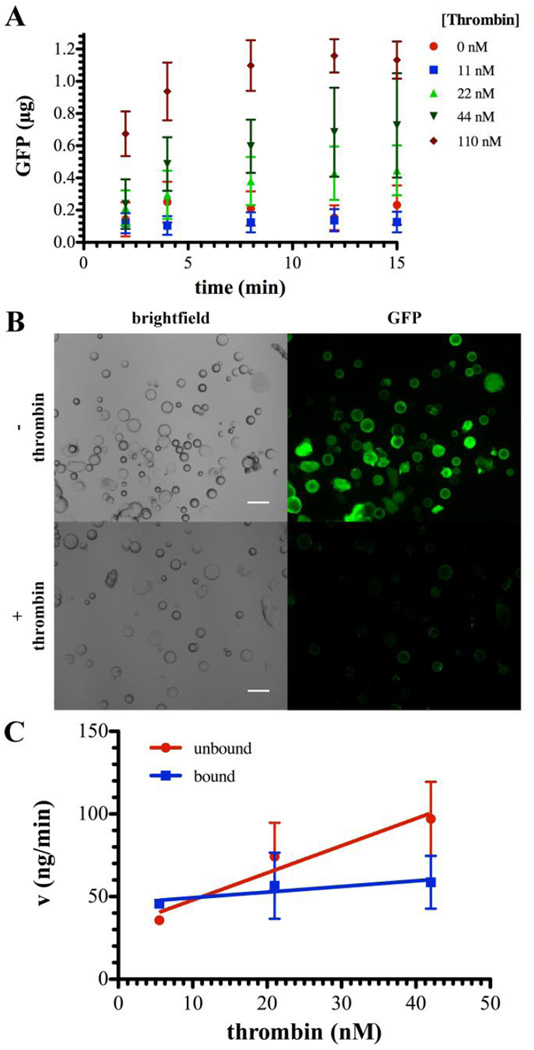
Fig. 5. Thrombin cleavage of GST-GFP from with PEGDA microspheres.
(A) Release of GFP from GST-GFP PEGD-GSH microspheres in the presence of ( ) 0, 11 (
 ), 22 (
 ), 44 (
 ), or 110 (
 ) nM thrombin as detected by fluorescent GFP signal. Each point represents the mean plus or minus the standard deviation of three independent samples. (B) Representative brightfield and epifluorescent micrographs depicting GST-GFP (green) associated with microspheres before (top row) or after (bottom row) release in response to thrombin (1.8 µM). (C) Rate (v) of GFP liberation from GST-GFP (unbound;
  ) and GST-GFP (bound;
  ) bound to PEGDA-GSH microspheres for the linear portion of the rate curve, typically the first 1 hour. Each point represents the mean plus or minus the standard deviation of three independent samples.

