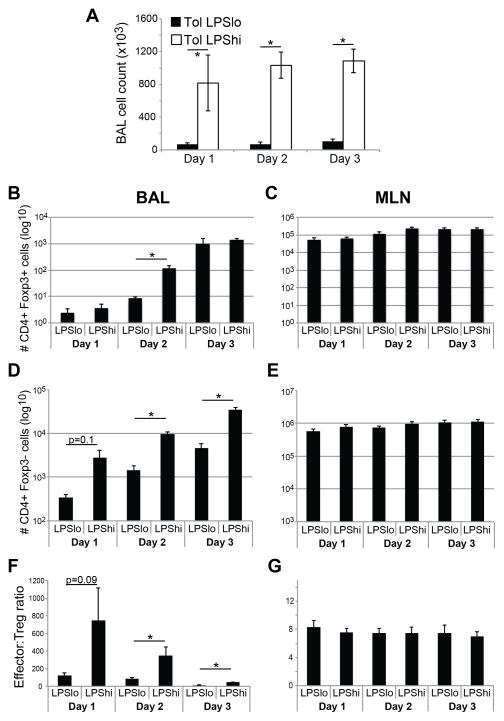
Figure 5. Analysis of cellular dynamics in BAL and draining MLN of tolerized mice following mucosal sensitization.
A) Total BAL cell recovery 18hr after each of three sensitizations with either LPSlo/OVA or LPShi/OVA. B–E) Flow cytometric analysis of BAL (B, D) and MLN (C, E) cells after sensitization. Absolute numbers of CD3+ CD4+ Foxp3+ cells (B–C) and CD3+ CD4+ CD44hi Foxp3- cells (D–E) are reported. F–G) Recovery of CD3+ CD4+ Foxp3+ and Foxp3- subsets were determined by flow cytometry. The ratio of CD4+ non-Treg to CD4+ Treg cells in BAL (F) and MLN (G) was determined by dividing the number of non-Treg by the number of Treg cells. n = 6–15 per group, * = p<0.05.

