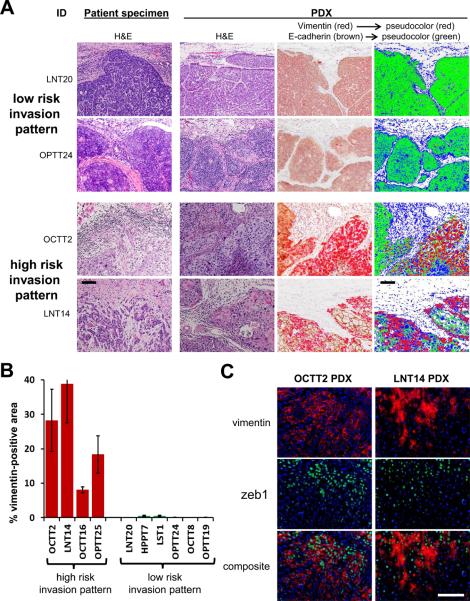
Figure 1. Abundant mesenchymal-like cells are present in PDXs of SCCs with infiltrative invasion.
A, Micrographs are of representative primary SCCs grouped by invasion pattern and their corresponding PDXs. Dual label IHC of PDXs for E-cadherin (brown) and vimentin (red) is shown together with digitally pseudo-colored images, in which E-cadherin is green, vimentin is red, and hematoxylin is blue. 20x. B, Vimentin positive area is compared between groups with high and low risk invasion patterns, quantitated as a percentage of total (E-cadherin+vimentin) staining area. Areas are defined as the mean ± SEM of three 40x fields. P<1×10⁻⁶ between groups. C, IF costaining of vimentin (red) and zeb-1 (green) is shown in sections of PDXs with high risk invasion patterns. 40x. Bars=100μm.

