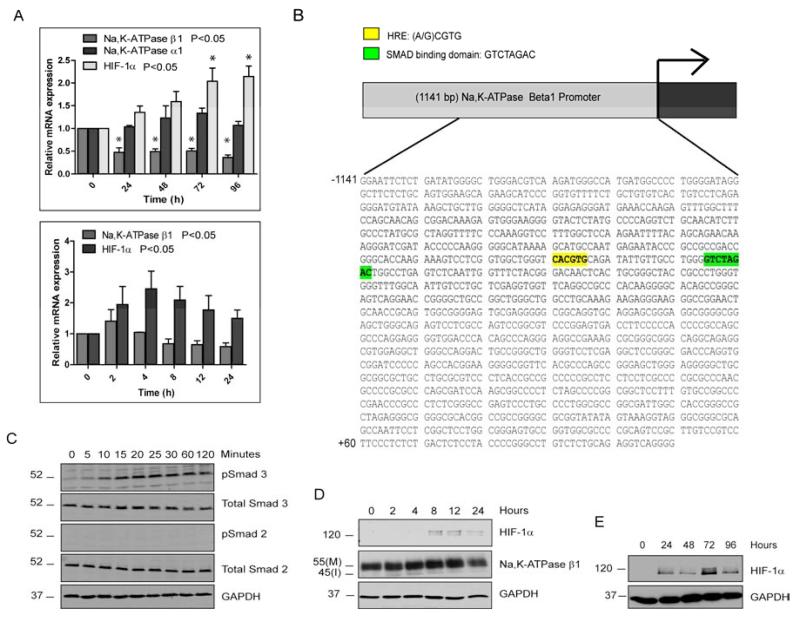
Figure 4. Analysis of potential transcriptional regulators of Na,K-ATPase β1.
(A) Relative mRNA levels of Na,K-ATPase β1, Na,K-ATPase α1 and HIF-1α after TGF-β2 treatment. The graph represents mean RQ ± SE of five independent experiments for Na,K-ATPase β1 and three independent experiments for Na,K-ATPase α1 and HIF-1α, all performed in triplicates. P<0.05 was considered statistically significant. (B) Promoter analysis of the 1141 bp Na,K-ATPase β1 gene promoter using the MatInspector software tool revealed a putative hypoxia response element (HRE, yellow) and Smad binding domain (SBD, green). (C) Immunoblots for phospho-Smad2 and phospho-Smad3 in ARPE-19 cells treated for 0, 5, 10, 15, 20, 25, 30, 60 and 120 minutes with TGF-β2. Total Smad2, total Smad3, and GAPDH were used as loading controls. (D) Immunoblot of HIF-1α and Na,K-ATPase β1 in ARPE-19 cells treated with TGF-β2-treated for 0, 2, 4, 8, 12 and 24 hours. GAPDH was used as loading control. Images are representative of three different experiments. (E) Immunoblot of HIF-1α in ARPE-19 cells treated with TGF-β2-treated for 0, 24, 48, 72 and 96 hours. GAPDH was used as loading control. Images are representative of three different experiments.

