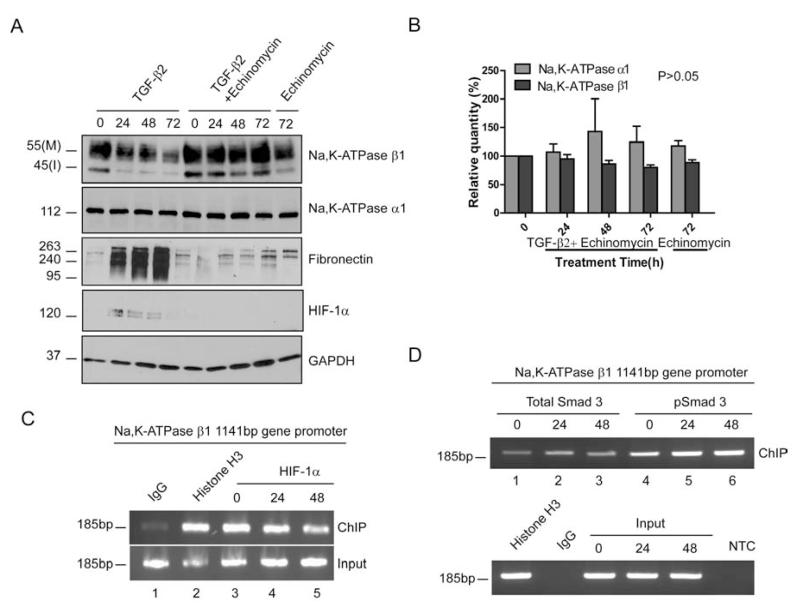
Figure 5. HIF-1α and Smad3 bind to the Na,K-ATPase β1 promoter.
(A) Na,K-ATPase subunit, fibronection and HIF-1α expression in ARPE-19 cells treated with 4 ng/ml of TGF-β2 and 0.3μM of echinomycin for 0, 24, 48 and 72 hours. GAPDH was used as loading control. (B) Na,K-ATPase α1 and β1 levels after 0, 24, 48 and 72 hours of TGF-β2 and Echinomycin treatment and 72 hours of Echinomycin treatment. Graph represents mean ± SE of three independent experiments. (C and D) ChIP assay in ARPE-19 cells treated for 0, 24 and 48 hours with TGF-β2. IgG, histone H3 and HIF-1α, Smad3 and pSmad3 represent antibodies used to pull down chromatin fragments (ChIP). Input represents the total fragmented chromatin before IP. Anti-mouse IgG was used as negative control IP. IP using Histone H3 was used as positive control. PCR primers were designed to amplify the specific region in the Na,K-ATPase β1 promoter containing the HRE and SBD after ChIP and the 185bp PCR product was run on a 1.5% agarose gel. NTC represents no template PCR control. Images are representative of three independent experiments.

