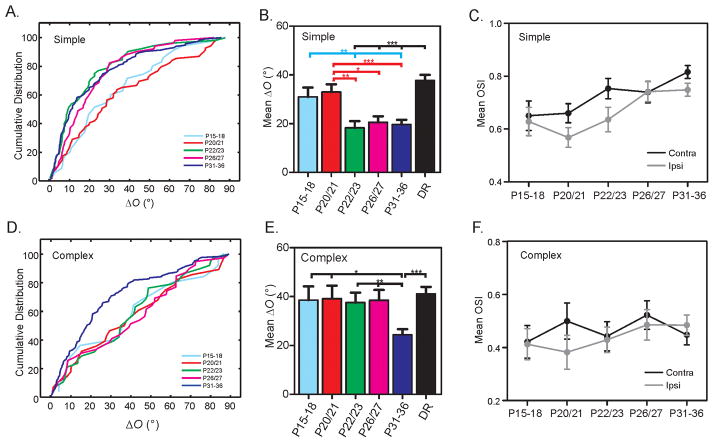
Figure 2. Simple cells match binocular orientation preference before complex cells.
(A) Cumulative distribution of ΔO for simple cells in five age groups during development: P15–18, P20/21, P22/23, P26/27, P31–36. (B) Mean ΔO of simple cells is high at P15–18 and P20/21, similar to the dark-reared (DR) mice, then decreases and reaches the mature level by P22/23. (C) Mean OSI of simple cells increases during development for both contralateral (P15–18 vs. P31–36, P < 0.05) and ipsilateral (P15–18 vs. P31–36, P = 0.06; P20/21 vs. P31–36, P < 0.001) eyes. (D) Cumulative distribution of ΔO for complex cells in all five age groups during development. (E) Mean ΔO of complex cells is high from P15 to P27, very similar to the DR group. It decreases after P27 and reaches mature level by P31–36. (F) Mean OSI of complex cells remains similar during development for both contralateral (P15–18 vs. P31–36, P = 0.79) and ipsilateral (P15–18 vs. P31–36, P = 0.50) eyes. Error bars represent mean ± SEM (*p < 0.05, **p < 0.01, ***p < 0.001). See also Table S1.

