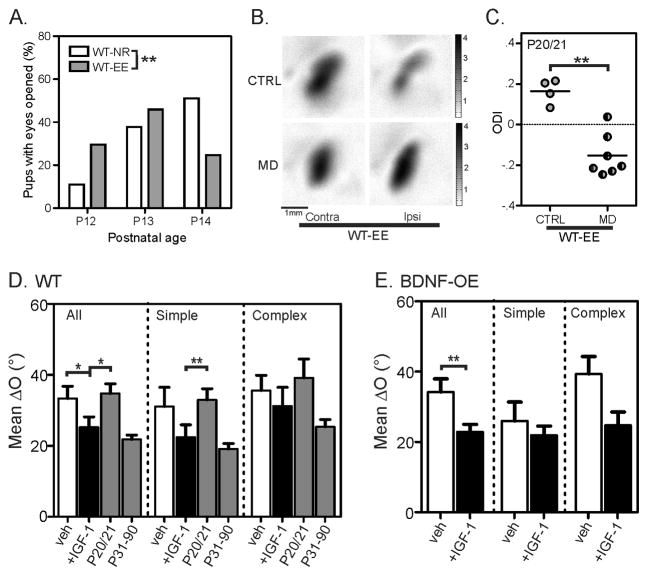
Figure 5. IGF-1 advances binocular matching and rescues the matching deficit in BDNF-OE mice.
(A) EE induces slightly earlier eye opening (WT-NR: mean = 13.4 ± 0.1 days, n = 53 mice; WT-EE: mean = 12.9 ± 0.1 days, n = 61; Mann-Whitney rank sum test: p < 0.01). (B) Examples of response magnitude maps from enriched WT mice (WT-EE), with strong contralateral bias in control (top row, imaged at P20) and more balanced responses after depriving the contralateral eye from P15 to P20 (bottom row). (C) A significant shift in ocular dominance index (ODI) is seen in the WT-EE mice after 5–6 days of MD starting at P15 (Mann-Whitney rank sum test: p < 0.01). (D) Mean ΔO of all (left), simple (center), and complex (right) cells in vehicle (0.1% BSA, open bars) and IGF-1 (black bars) treated P20/21 WT. The unmanipulated P20/21 and P31–90 groups are shown in the gray bars to illustrate the normal level of binocular matching at the two ages for comparison. (E) Mean ΔO of all (left), simple (center), and complex (right) cells in vehicle (0.1% BSA, open bars) and IGF-1 (black bars) treated P31–38 BDNF-OE mice. Error bars represent mean ± SEM (*p < 0.05, **p < 0.01, ***p < 0.001). See also Figure S4 and Table S1.

