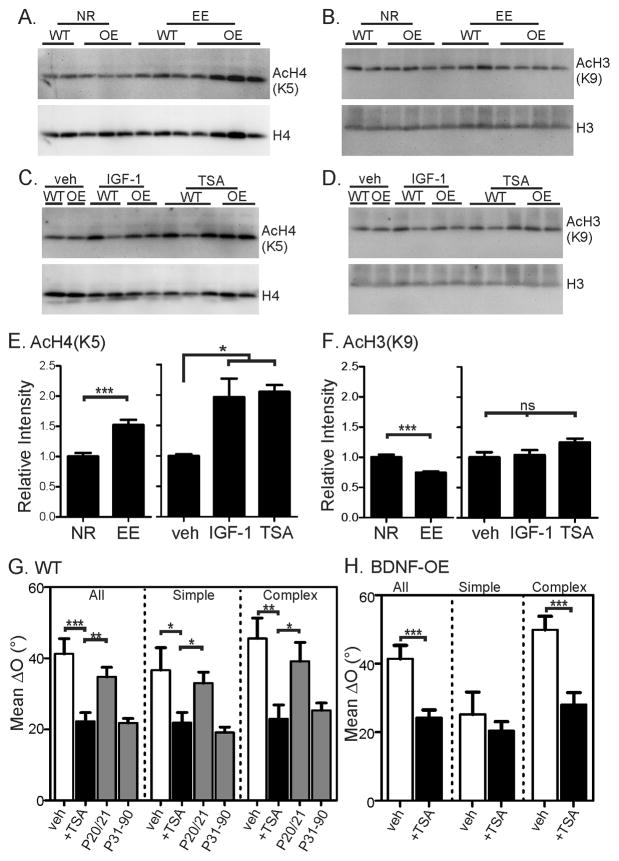
Figure 6. Environmental enrichment induces acetylation of histone H4 to advance binocular matching.
(A) Representative images of Western blots for acetylated H4K5 (top) and total H4 (bottom) in the visual cortex of normal-reared (NR) and EE mice. (B) Representative Western blots for acetylated H3K9 (top) and total H3 (bottom) in NR and EE mice. (C–D) Representative Western blots for acetylated and total H4 (C) and H3 (D) in IGF-1 and TSA treated mice. (E–F) Quantification of relative levels of acetylated H4K5 (E) and H3K9 (F). Each group included both WT and BDNF-OE (OE) mice and was normalized by the mean of the unmanipulated samples on the same gel. T-test was used to compare NR vs. EE; 1-way ANOVA and Tukey post test was used to compare vehicle (veh), IGF-1, and TSA-treated mice. In E, NR: n = 16 (8 mice); EE: n = 20 (8); veh, n = 4 (2); IGF-1, n = 8 (4); and TSA, n = 10 (5). In F, NR: n = 15 (8); EE: n = 19 (8); veh, n = 4 (2); IGF-1, n = 8 (4); and TSA, n = 10 (5). (G) Mean ΔO of all (left), simple (center), and complex (right) cells in vehicle (0.5% DMSO, open bars) and TSA injected (black bars) WT mice. The unmanipulated P20/21 and P31–90 groups (grey bars) are shown to illustrate the normal level of binocular matching at the two ages for comparison. (H) Mean ΔO of all (left), simple (center), and complex (right) cells in vehicle (0.5% DMSO, open bars) and TSA treated (black bars) P31–38 BDNF-OE mice. Error bars represent mean ± SEM (*p < 0.05, **p < 0.01, ***p < 0.001). See also Figure S4 and Table S1.

