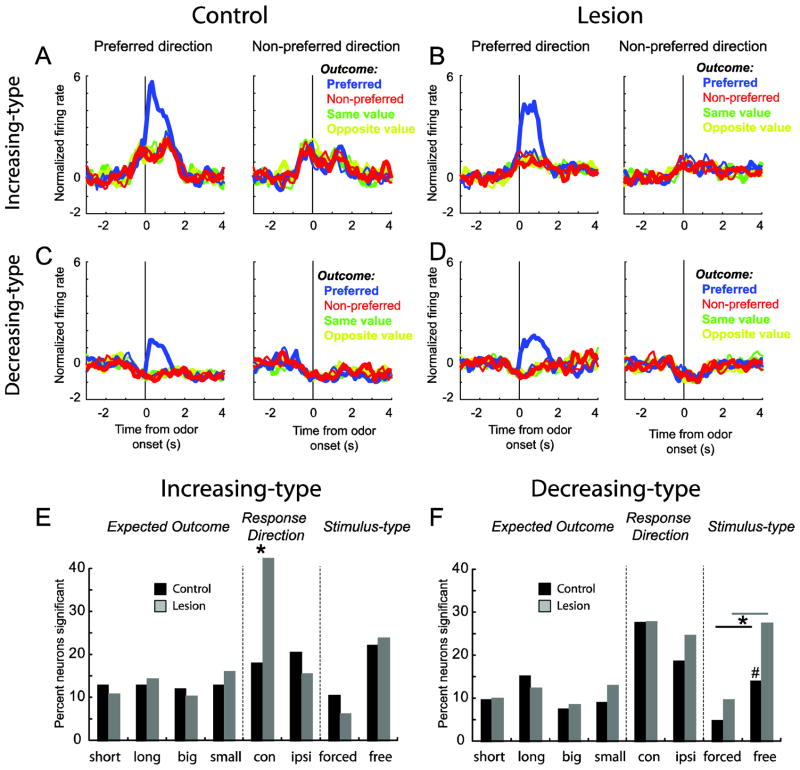
Figure 3. Stimulus and response encoding in decreasing- and increasing-type DS neurons was enhanced after VS lesions.
A–D. Average firing rate over all increasing (A–B) and decreasing (C–D) type neurons for controls (A and C) and lesions (B and D) for free- or forced-choice trials, depending on which elicited the strongest response. All trials are referenced to the trial-type that elicited the maximal firing during the time starting 100 ms after odor onset to entry into the fluid well. See text for more detail. Data were normalized by subtracting the mean and dividing by the standard deviation (Z score). Blue = preferred outcome; red = non-preferred outcome; green = same value and yellow = opposite value; thin = first 5 trials; thick = last 5 trials. E–F. Height of each bar indicates the percent of neurons that showed a main or interaction effect of outcome (short, long, big and small), direction (contra and ipsilateral) and odor-type (free and forced choice odors). * p < 0.05; # = 0.057; chi-square.

