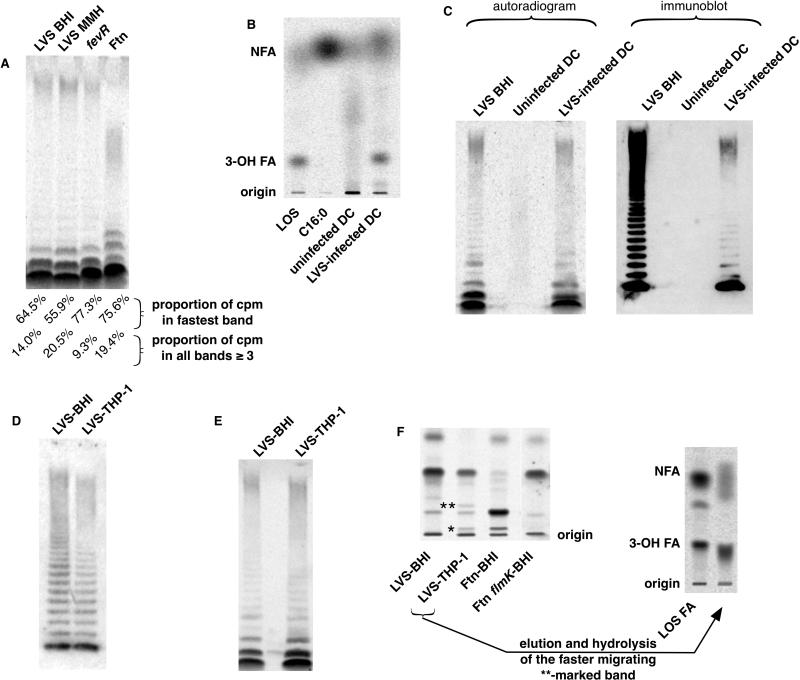
Figure 4.
Comparison of metabolic labeling of Francisellae with [14C] acetate under different growth conditions and in different strains and subspecies. (A) SDS-PAGE/autoradiography of [14C]-labeled EtOHp from the indicated bacteria. Quantitation of the [14C] within the fastest migrating band and within all bands migrating slower than the two faster migrating bands was determined by [14C] imaging. Results are representative of two independent experiments. (B) Human DC were incubated either alone or after infection with LVS in culture medium containing [14C]acetate. After 48 h incubation, harvested DC were subjected to hydrolysis and NP-TLC, along with the indicated controls. (C) Uninfected DC, LVS-infected DC, and BHI-grown LVS were subjected to SDS-proteinase K digestion followed by precipitation in acidic EtOH. The recovered EtOHp were subjected to SDS-PAGE followed by autoradiography and immunoblot for LVS O-antigen. Equal cpm from EtOHp of extracellular LVS and infected DC were loaded; the much lower yield of cpm in the recovered EtOHp from the uninfected DC resulted in loading of 8-fold fewer cpm from this sample. Results are representative of two experiments of identical design. (D) Equal quantities EtOHp derived from either BHI- or THP-1-grown LVS (as determined by LC-MS quantitation of 3-OH C18:0) were subjected to SDS-PAGE/immunoblot for O-antigen. (E) Similar cpm of the same samples were subjected to SDS-PAGE/[14C]autoradiography. (F) (left) Free lipid A isolated from EtOHp of the indicated samples was extracted by modified Bligh-Dyer extraction and resolved by chloroform/pyridine/formic acid/methanol/water TLC. * and **, bands appearing only in LVS grown within THP-1 and not in BHI-grown LVS. (right) The band indicated by ** was extracted from the TLC plate and subjected to chemical hydrolysis and NP-TLC to reveal 3-OH-FA.

