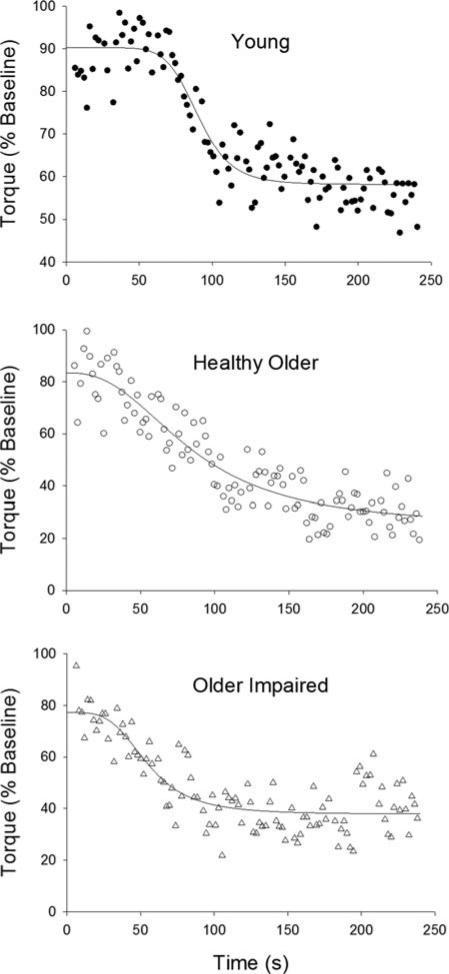
FIGURE 3.
Non-linear regression analyses. A 4-parameter logistic regression was applied to the peak torque values for each participant, from 5 to 240 s of the fatigue protocol. Data and fits from representative young (top), healthy older (middle), and older impaired (bottom) participants are shown. Asymptotes at the onset and end of the fatigue protocol, as well as coefficients for the curvature and slope of the line, were obtained from each fit. See Methods for details and Table 4 for results.

