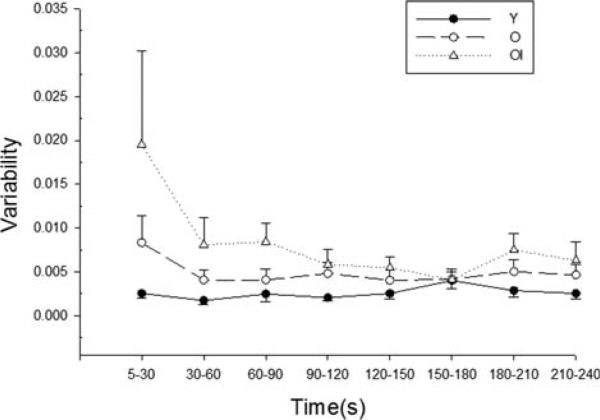
FIGURE 4.
Torque variability. Group mean variability during the 4-min fatigue protocol. Variability was calculated for each individual based on the distance of each peak torque value (in “y” direction) from the nonlinear fit of all contractions between 5 and 240 s, and expressed as percent MVC squared (see text for details). There was a main effect of group (Table 4), and the older impaired group had higher variability than the young group (P = 0.010). There were trends for an effect of time (P = 0.079) and a time-by-group interaction (P = 0.075; see Discussion). Data are in 30-s bins, with the exception of the first time-point, which is a 25-s bin. Error bars are SE.

