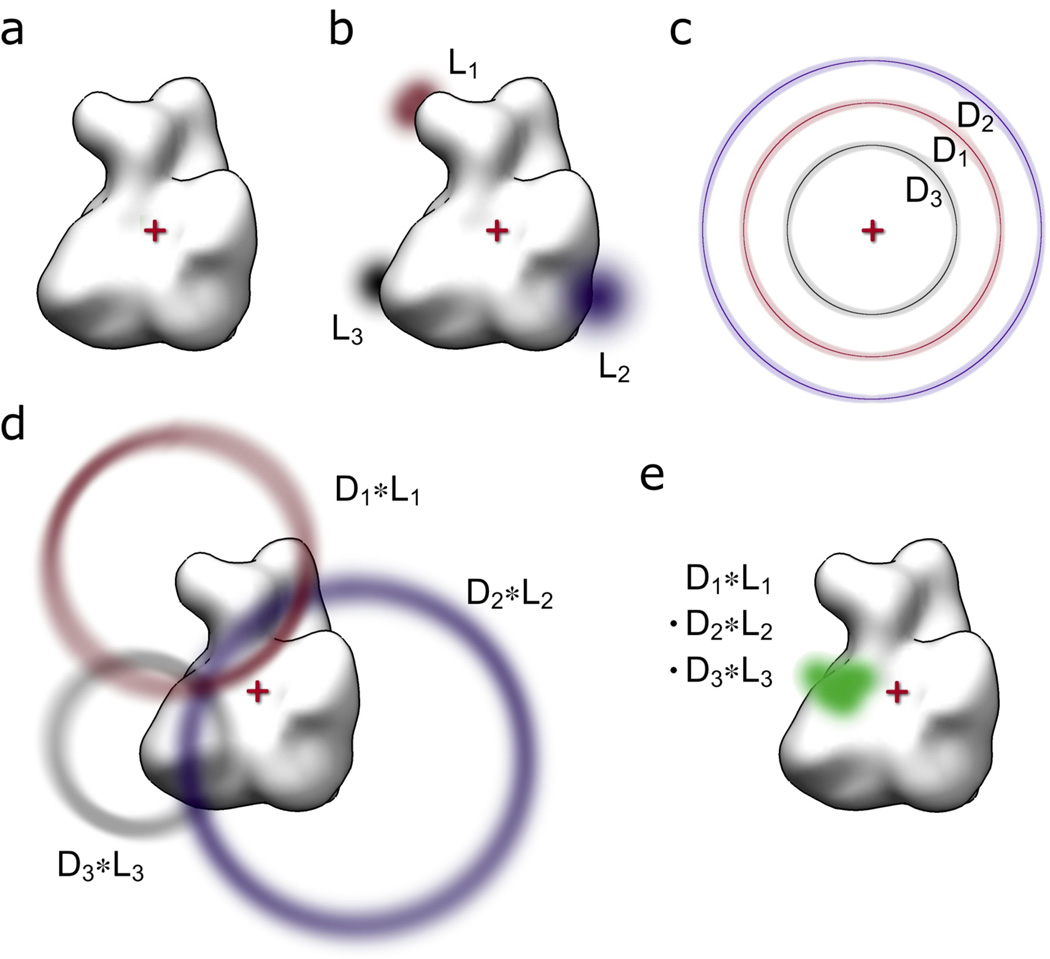
Figure 1. Schematic overview of methodology.
(a) The common coordinate system is defined with the origin (red cross) set to the center of the macromolecular structure (white surface representation). (b) The probability functions for the locations of attachment points (L1, L2, L3) are derived in the common coordinate system. (c) The experimental distance constraints are mapped onto spheres centered at the origin to derive the corresponding probability functions (D1, D2, D3). (d) The distance and location probability functions are convoluted (LN * DN) to derive the probe location probability functions for each location/distance pair. (e) All location/distance pair probability functions are multiplied voxel-wise to derive the final probability function for the probe location (green).

