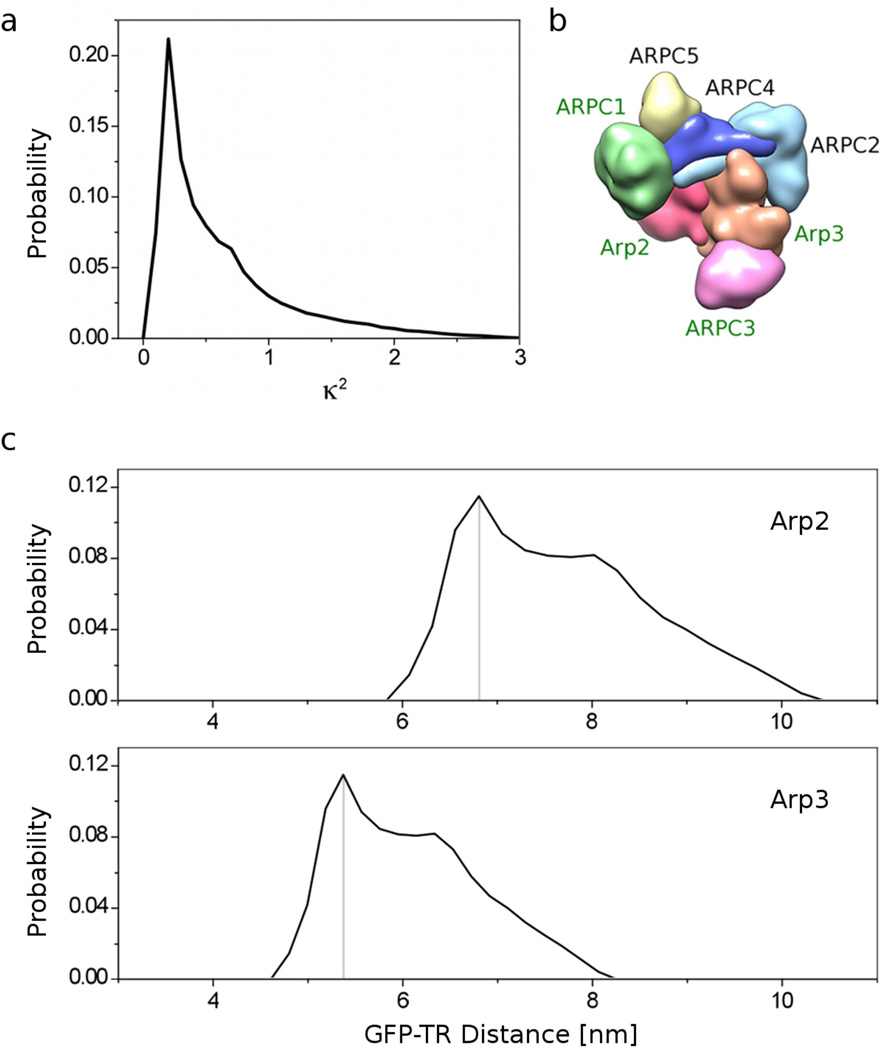
Figure 4. Construction of probability function of FRET distances.
(a) Probability distribution of κ2 calculated from measured anisotropies of donor and acceptor. (b) The seven subunits of the Arp2/3 complex. Arp2/3 constructs with GFP attached to Arp2 (red surface), Arp3 (orange), ARPC1 (green) or ARPC3 (magenta) were used in this study. This view is towards the pointed ends of Arp2 and Arp3. (c) Probability curves for the distances between the Texas red probe (TR) attached to the A site of the CA Scar NPF construct and the center of GFP attached to the C-terminus of Arp2 (top panel) or Arp3 (bottom panel). These curves were derived from FRET under the worst-case scenario assumption that for every donor-acceptor pair in the solution, there was a fixed orientation of donor and acceptor dipoles relative to one another, and the dipoles rotated about this position according to the mobility given by their anisotropies. Note how badly a Gaussian distribution centered at the most probable distance (marked by gray line) would approximate these curves.

