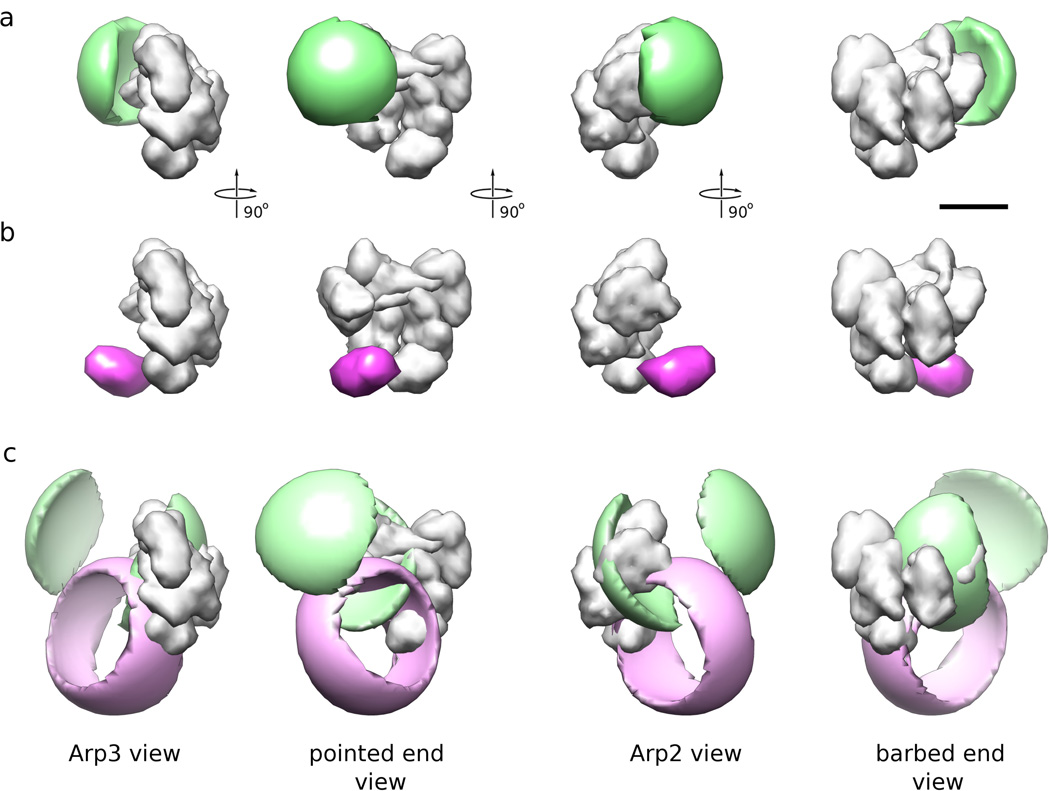
Figure 5. Probability function for GFP locations and FRET distance probability functions in common coordinate frame.
(a) Location probability of GFP center when attached to the C-terminus of ARPC1 (green). A low-resolution representation of Arp2/3 complex (gray surface) is shown for reference. There was no electron density attributable to the GFP present in the reconstruction of the corresponding Arp2/3 complex so this distribution is calculated form general constraints (see text). Four orthogonal views are shown, the length of the scale bar is 5 nm. (b) Location probability of GFP center when attached to ARPC3 (magenta). The difference map between the corresponding Arp2/3-GFP construct and the control Arp2/3 complex reconstructions (Fig. 1) was used to calculate this distribution. (c) FRET distance probability distributions for Texas red attached to the A site of the CA Scar NPF construct and GFP attached to ARPC1 (green) or ARPC3 (magenta). These distributions were calculated by mapping the 1D FRET distributions onto a 3D sphere and convoluting it with the GFP location probabilities shown in (a) and (b).

