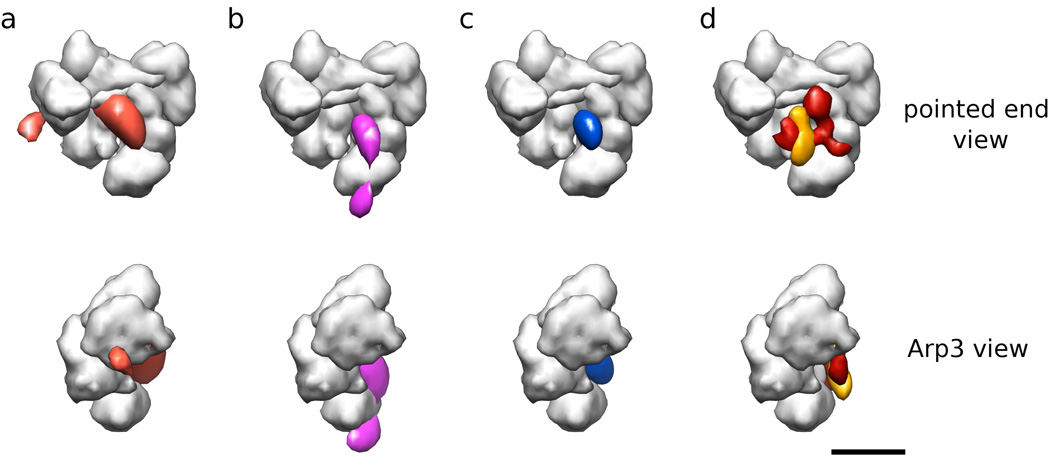
Figure 7. Joint probability functions for FRET distances in common coordinate frame from multiple FRET pairs.
(a) Joint probability (orange) of FRET pairs from Texas red attached to the A site of the CA Scar NPF construct and GFP attached to Arp2, ARPC1, and ARPC3. A low-resolution representation of Arp2/3 complex (gray surface) is shown for reference. Two orthogonal views are shown. (b) Joint probability (pink) of FRET pairs from Texas red attached to the A site of the CA Scar NPF construct and GFP attached to Arp2, Arp3, and ARPC3. (b) Joint probability (blue) of all four FRET pairs from Texas red attached to the A site of the CA Scar NPF construct and GFP attached to Arp2, Arp3, ARPC1, and ARPC3. The region shown encloses 0.5 of the probability. (d) Difference map calculated from subtraction of the Arp2/3 complex reconstruction from a reconstruction of Arp2/3 complex with bound VCA Scar NPF construct (red) and difference map calculated from subtracting the latter from a reconstruction of the same construct labeled with maltose-binding protein at the V site of VCA (orange). Note the excellent correspondence with the blue probability density in (c). The length of the scale bar is 5 nm.

