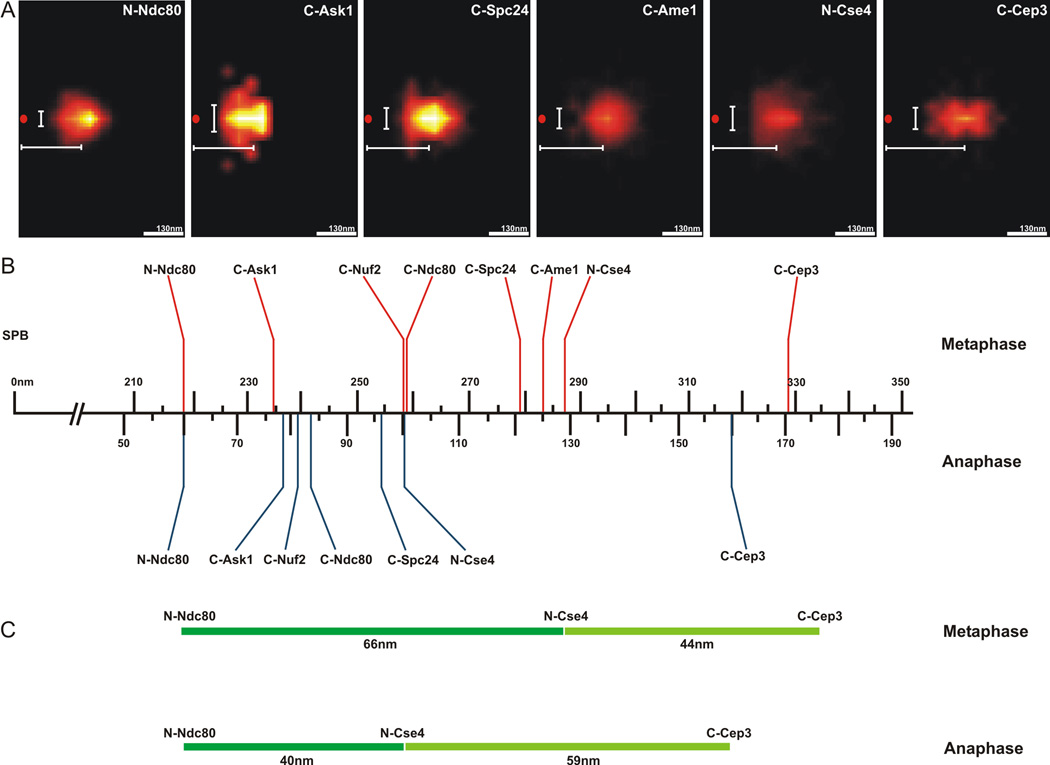
Figure 1. Two-Dimensional Mapping of Representative Kinetochore Proteins and Pericentric Chromatin.
A. The peak intensity (pixel) of clustered kinetochore foci (Ndc80, Ask1, Nuf2, Spc24, Ame1, Cse4 and Cep3), were determined and the coordinates of the brightest pixel of each spot were plotted relative to the spindle pole body (SPB), (0,0)nm. The horizontal bar (white) below the position of each density map indicates the average distance along the x-axis from the spindle pole (SPB red spot). The vertical bar (white) left of the density map indicates the average displacement along the y-axis.
B. The average distance from density maps for representative proteins was determined and plotted relative to the spindle pole body (n=1064 for Ndc80, n=1032 Cse4 and n=~100 for others). Above the axis are distance measurements from metaphase cells (red)(adapted from Fig. S4 in [2]). Below the axis are distance measurements taken from anaphase cells (blue). The kinetochore is approximately 68nm in length from the N-terminus of microtubule binding protein Ndc80p to the N-terminus of the centromere-specific histone H3 variant, Cse4p. The density maps recapitulate the linear distances determined by pairwise centroid mapping (see Fig. S4 in [2]) and allow us to map the average position of components that are larger than diffraction limited spots.
C. The change in kinetochore length (dark green) and centromere proximal chromatin (Cse4-Cep3)(Light green) from metaphase (top) to anaphase (bottom).
See Figure S1 for detailed methodology, Table S1 for assessment of localization accuracy and Table S2 for accuracy of brightest pixel vs. centroid of Gaussian fits.

