
Figure 2. Model convolution recapitulates Ndc80 at microtubule plus-ends but not chromatin bound Cse4.
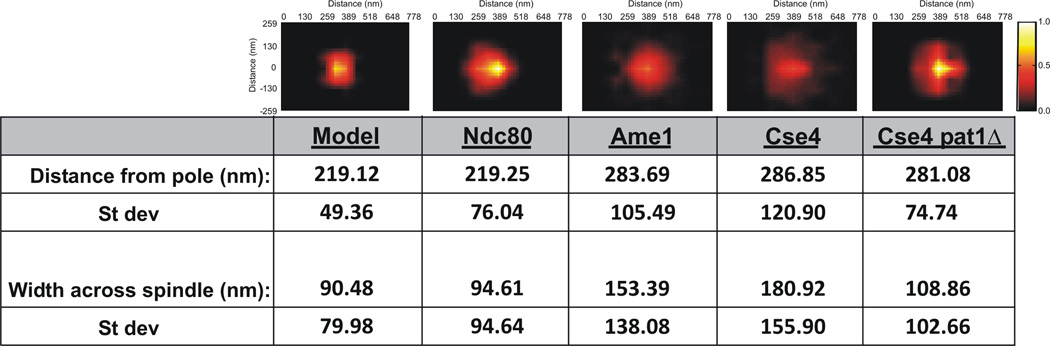
(Top Panels) Statistical probability maps from experimental and simulated images (Model, Ndc80, Ame1, Cse4, Cse4 pat1Δ). (Bottom) Statistical analysis of images. Distance from the pole is the mean distance. The width across the spindle is determined by summing the average distance above and below the spindle axis. As shown in Figure S1 the density maps are mirrored from one quadrant. Experimental density maps for Ndc80 and Cse4 are generated from >1000 images. Simulated density maps (model) and experimental Ame1 and Cse4pat1Δ are generated from >200 images.
See Figure S2 for line scans through the respective probability maps.