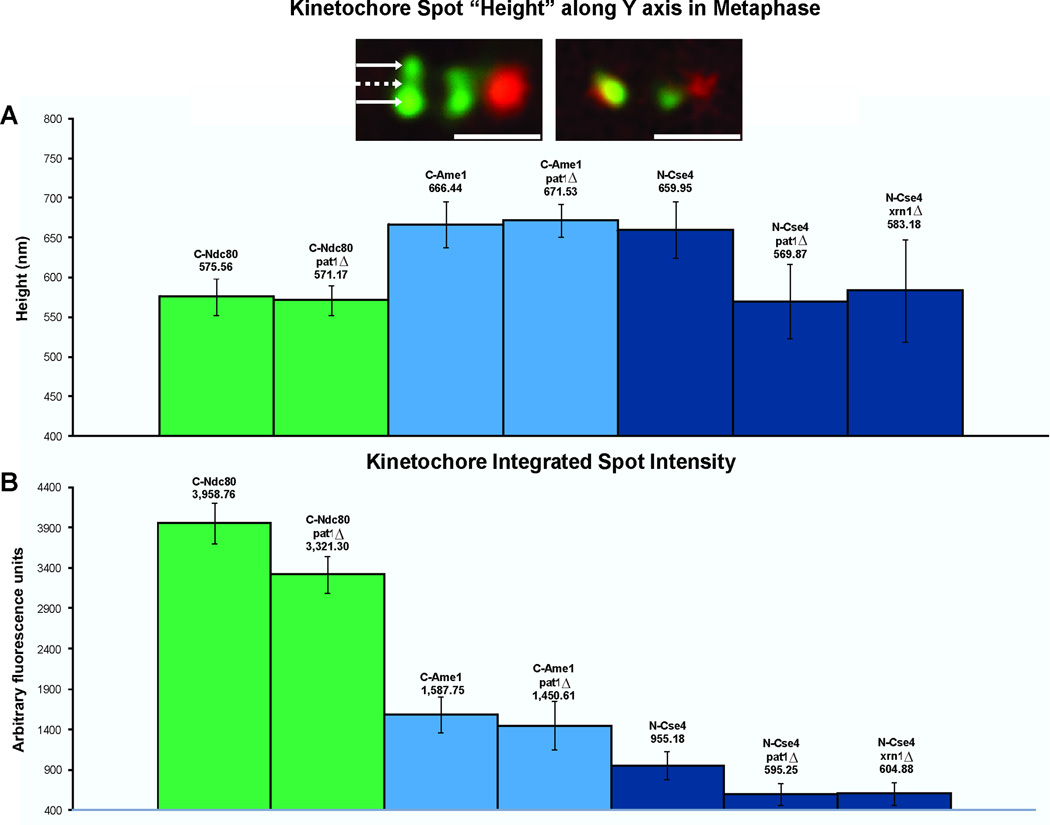
Figure 3. Quantitative Fluorescence and Kinetochore Anisotropy.
A. The height of the cluster of kinetochore proteins was determined from line scans (perpendicular to the spindle axis) through the protein cluster. The height was determined from the full-width full-maximum (FWFM) of the Gaussian distribution. Foci of Cse4-GFP extend perpendicular to the spindle axis (660 nm y axis) compared to outer kinetochore Ndc80-GFP (576 nm y axis). The aspect ratio (height/width) for Cse4 is 1.23 versus 1.07 of Ndc80. The cluster of Cse4 is no longer anisotropic in pat1Δ or xrn1Δ mutants (pat1Δ 570nm, xrn1Δ 583nm, aspect ratio width/height = 1.06). Inset: Deconvolution microscopy of Cse4 in wild-type and pat1Δ mutants. Left, Cse4 (green) appears punctuate upon deconvolution. Arrows mark peaks of bright spots (outer arrows) and dim center (middle dashed arrow). The average outer peak intensity is 352 ± 64 arbitrary units. The average center intensity is 146 ± 35 arbitrary units. The ratio of outer/inner intensity = 2.4. Right, Cse4 in pat1Δ (green) appears as a single spot coincident with the spindle axis (Spindle pole body, red). Scale bars represent 1 μm.
B. The fluorescence intensity of Cse4, Ndc80, and Ame1 in wild-type, pat1Δ or xrn1Δ metaphase cells. There is a 40% decrease in Cse4 at the centromere in the absence of Pat1 and Xrn1. There is 15% decrease of Ndc80 and 10% decrease of Ame1. Whole cell Cse4 fluorescence is not reduced in mutant cells (wt 24,355 a.u., pat1Δ 32516 a.u., xrn1Δ 33,654 a.u. (arbitrary units)). See Fig. S3A for chromatin immunoprecipitation of centromeric Cse4 in the absence of pat1Δ.

