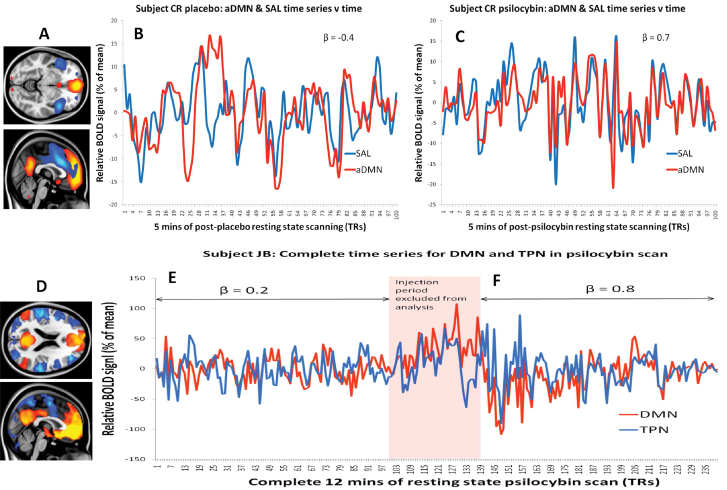
Fig. 2.
The effect of psilocybin on DMN connectivity seen at the single-subject level. (A) The aDMN (orange) and salience network (blue) derived from Independent Components Analysis. (B) An illustrative single-subject time series for the DMN (red) and salience network (blue) after placebo injection. (C) The same subject’s time series for the DMN and salience network after psilocybin injection. Note the increase in FC between the DMN and salience network after psilocybin vs after placebo. (D) Positive (orange) and “negative” (blue) FC with the ventromedial prefrontal cortex (vmPFC) based on data from fifteen placebo condition 12-min resting-state scans. This vmPFC-positive network is the DMN, and the vmPFC-negative network is the task-positive network. (E) The complete time series for the DMN and task-positive network (TPN) for a single subject’s psilocybin scan. Note the increase in DMN-TPN FC after psilocybin. Subject CR rated the intensity of the effects at 9/10 and JB 10/10.

