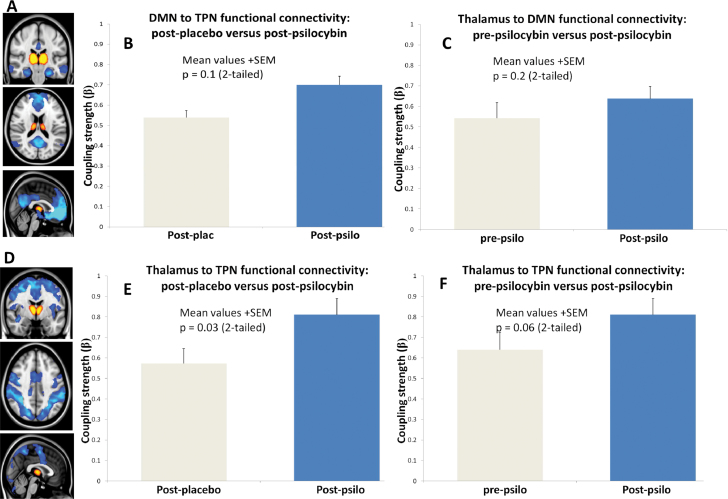
Fig. 4.
Thalamic connectivity with the DMN and TPN. (A) The thalamic (orange) and DMN (blue) masks from which time series were extracted. (B) Thalamic-DMN connectivity postplacebo vs postpsilocybin (P = .1). (C) Thalamic-DMN connectivity postpsilocybin vs prepsilocybin (P = .2). (D) The thalamic (orange) and TPN (blue) networks from which time series were extracted. (E) Thalamic-TPN connectivity postplacebo vs postpsilocybin (P = .03). (F) Thalamic-TPN connectivity post- vs prepsilocybin (P = .06).

