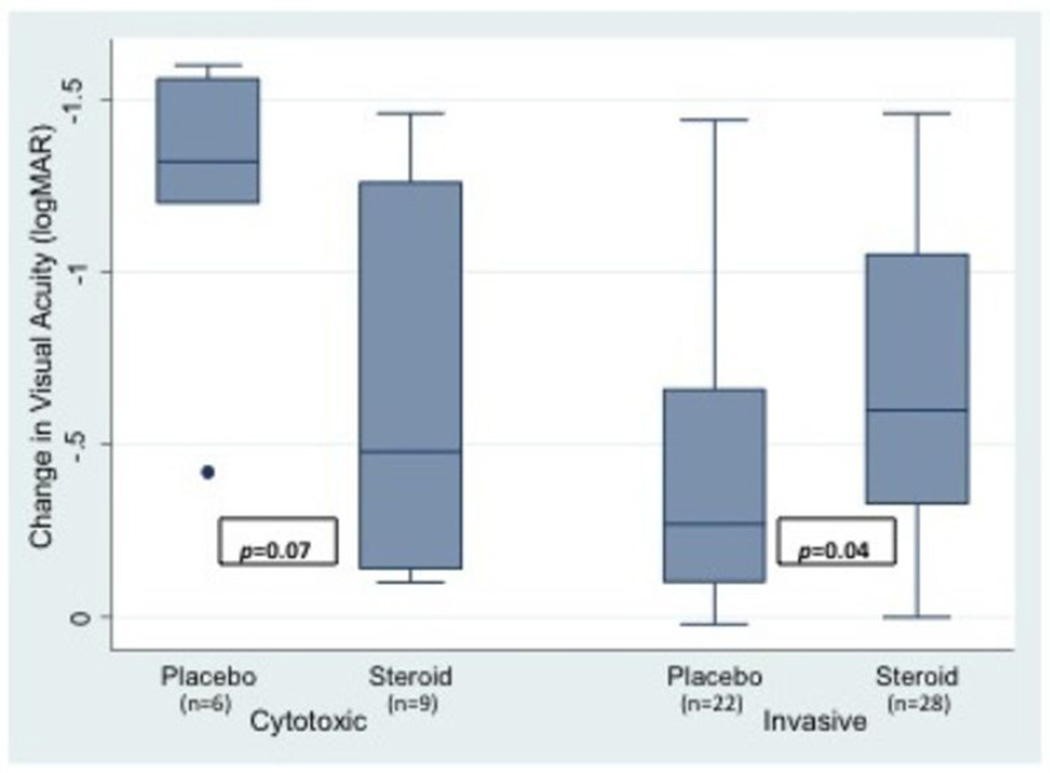
Figure 2. Change in logMAR BSCVA at 3 months by treatment arm (placebo vs. steroid) for each P. aeruginosa strain type.
The median for each group is represented by the line in the middle of each box. The interquartile range(IQR), the span of the 25th to 75th percentiles, is denoted by the lower and upper bounds of each box, respectively. The whiskers extend from the smallest visual acuity change within 1.5×IQR below the 25th percentile to the largest visual acuity change within 1.5×IQR above the 75th percentile. Individual data points denote values outside this range. P-values displayed in the figure were obtained by two-group mean-comparison t-test. P-value for the interaction term between strain type and treatment arm was 0.005 and was obtained using Huber robust regression.

